
Owing to its public license, Elasticsearch is source-available and free to use. This status has made this corporate search engine very popular and applied to a wide number of applications. You might find that Elasticsearch lies at the core of your SIEM system or your log management tool. There are even system monitors that use Elasticsearch to drive their data management systems.
Elastic NV, the company that owns Elasticsearch is changing its licensing model to gain more control over the system. This is because many other businesses have appropriated the search system for their commercial products. This is particularly noticeable in the AWS Elasticsearch system.
Here is our list of the six best Elasticsearch monitoring tools:
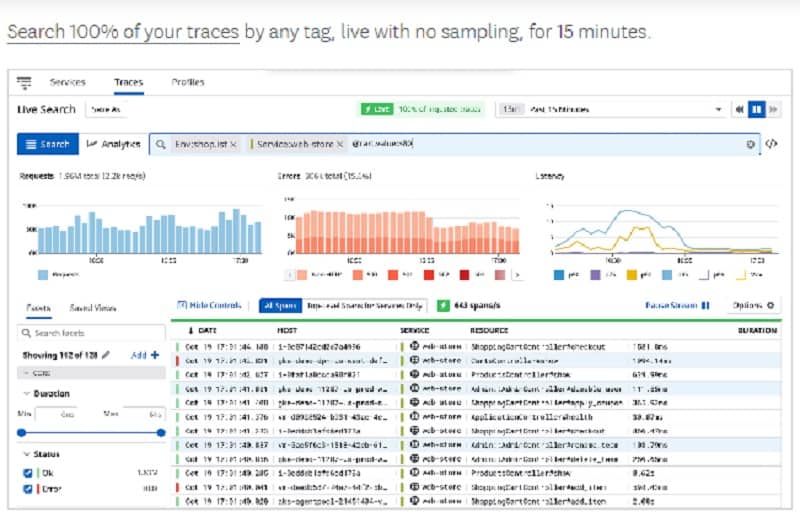
- AppOptics EDITOR’S CHOICE A cloud-based monitoring service that has add-ons for Elasticsearch and AWS Elasticsearch monitoring. This SaaS system can unify the supervision of all Elasticsearch instances no matter where they are hosted. Start a 30-day free trial.
- Datadog Infrastructure A monitor for system services and resources that can be expanded to cover Elasticsearch. This is a SaaS system.
- Site24x7 Infrastructure A cloud-based system monitoring tool that has an add-on for Elasticsearch coverage.
- Dynatrace An AI-based monitoring service for networks, servers, and applications that will monitor Elasticsearch instances on-premises and in the cloud.
- ManageEngine Applications Manager An applications monitor that includes Elasticsearch monitoring. It installs on Windows Server or Linux.
- Opsview A flexible monitoring tool that has a plugin for Elasticsearch monitoring. It is available in versions for installation on Linux or as a cloud service.
Elastic Stack
Elasticsearch is part of Elastic Stack, a suite of useful tools that, individually, have become very popular and together can provide a comprehensive data analysis system that can be deployed with a range of data sources. Elastic Stack is abbreviated to ELK and the other two stars in the pack are Kibana, a data viewer and interface, and Logstash, a log server, and consolidator. Like Elasticsearch, these other two free tools are recommended by a range of data management services and provide key functionality that those systems lack.
One other way you can access Elasticsearch is through the Elastic Cloud service. This is a charged-for SaaS system that is a hosted version of the ELK stack. Elasticsearch is also offered on the Azure platform and Google Cloud as well as the well-known AWS version.
Monitoring Elasticsearch
There are many ways to use Elasticsearch and if you don’t have it already, you might be considering trying it out. You might need to install Elasticsearch in order to use another product, such as a SIEM system.
The tools you can use to monitor your Elasticsearch implementation depend on which platform you use the search engine. Elasticsearch and its fellow ELK components install on Windows, macOS, and Linux. Also, as mentioned, you might choose to access Elasticsearch on AWS, Azure, or Google Cloud.
Clearly, when you are looking for a monitoring system for Elasticsearch, you need to be sure it can access the operating system you installed Elasticsearch on. However, there are a number of monitoring tools that can access all of these platforms. A monitor that has multi-platform capabilities gives you flexibility for the future. You particularly need a hybrid approach if you already use Elasticsearch on several platforms.
The best Elasticsearch monitoring tools
When searching for the best monitoring tools for Elasticsearch, we focused on system performance monitors that cover many different resources as well as Elasticsearch. This strategy gives you a system that can monitor as much of your IT resources as possible and reduces the need to switch between dashboards in your day-to-day IT operations management tasks.
We have identified a range of services, some of which you will need to install on your own servers and others that are subscription services hosted on the SaaS delivery model. Clearly, the system that is right for you ties into your platform preferences.
In all cases, the tools we chose to recommend have the ability to monitor both on-premises and cloud implementations of Elasticsearch. These systems can also unify the performance monitoring of all Elasticsearch instances to provide an overview of live operations data. With any of these tools, you will be able to drill down from a consolidated overview to examine the performance of individual instances.
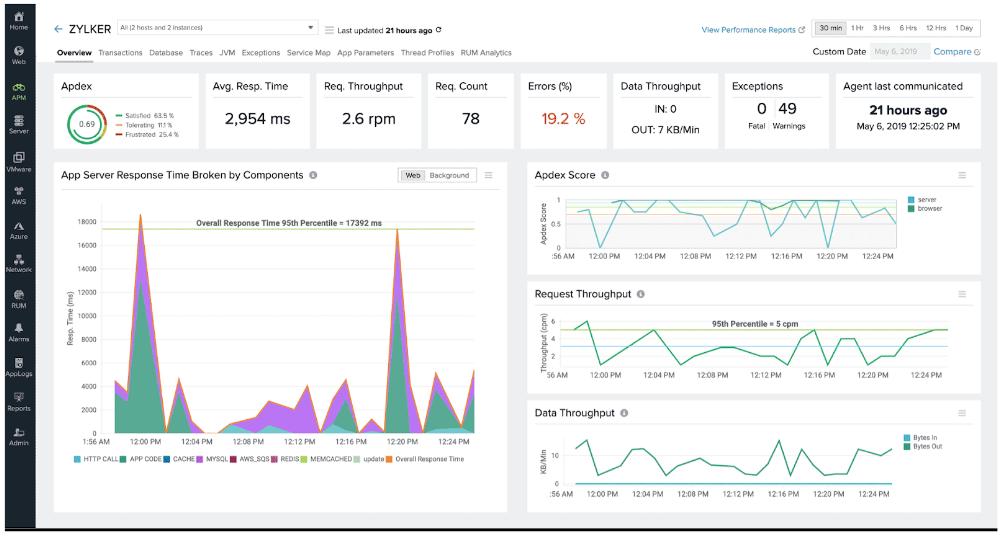
1. AppOptics (FREE TRIAL)

As a cloud-based system, AppOptics by SolarWinds includes the server to run the monitoring software on plus server space for data storage. This is an application performance monitor that also monitors server resources. It will monitor the performance of applications running on-premises and in the cloud. It can also handle hybrid environments.
The Elasticsearch monitoring feature of AppOptics is an “integration.” This is an add-on module but it is free to use and easy to install. AppOptics uses this system of integrations so that each customer only gets the features needed to monitor systems. The integrations library also includes an add-on for AWS Elasticsearch monitoring.
The Elasticsearch tool adds extra screens to the AppOptics dashboard. These show live performance data from all of your grouped Elasticsearch instances. You can drill down to observe each individual implementation.
The metrics that AppOtics looks at include data about clusters and nodes, server resource usage, Java memory management, action speeds, and interactions with Kibana.
AppOptics includes an automatic application detection system that builds up a plan of interactions between applications and services. This application dependency map is constantly updated and it is there to speed up root cause analysis should performance drop in any application. SolarWinds AppOpics assesses each monitored factor for acceptable performance levels and issues an alert if a service factor fails its tests. Alerts can be sent out as notifications by email and SMS if problems arise.
AppOptics is a subscription service and it is structured in two editions. The first of these is called Infrastructure Monitoring, which includes the Elasticsearch monitoring service. The higher plan is called Infrastructure and Application Monitoring. SolarWinds offers AppOptics on a 30-day free trial.
EDITOR’S CHOICE
SolarWinds AppOptics is our top pick for an Elasticsearch monitoring tool because it includes a high degree of automation that makes it easy to set up and use. The autodetection of applications and their links to other services means you don’t have to do much in order to get a full view of application dependencies. The alerting system allows you to leave Elasticsearch monitoring to the AppOptics service. This is a very competent service that is able to monitor Elasticsearch instances no matter where they are hosted.
Get a 30-day free trial: my.appoptics.com/sign_up?
Operating system: Cloud-based
2. Datadog Infrastructure
Datadog is a SaaS platform that offers a range of monitoring modules that specialize in different categories of resources. Datadog Infrastructure covers all of the services that lie behind user-facing software, back to server resources.
Datadog Infrastructure can be expanded by “integrations.” These are plugins that add the capabilities to monitor specific products and currently, there is a library of 400 of them. There is an integration for Elasticsearch available and another for Amazon Elasticsearch.
Datadog is able to monitor servers wherever they are hosted and it can unify the supervision of all of your Elasticsearch implementations. Its Elasticsearch monitoring service has its own screens in the system dashboard where live metrics can be viewed in the form of charts and graphs. As well as observing the performance of Elasticsearch itself, the service watches JVM performance and memory issues. It will track access to server resources and watch the availability of memory, CPU, and disk space.
Datadog Infrastructure creates performance thresholds on each monitored factor and applies machine learning to adjust them to a level that cuts out false alarms. Those alerts can be forwarded to technicians as notifications by email or messaging system.
An AI-based application tracking service, called Correlations generates a live application dependency map, which is constantly revised. This lays the groundwork for root cause analysis in the event of emerging problems.
Datadog Infrastructure is offered in three editions: Free, Pro, and Enterprise. The Free service will only monitor up to five hosts. The Pro edition includes access to those Elasticsearch integrations. The Enterprise system adds on AI-based services, such as Correlations and machine learning for performance thresholds. You can get a 14-day free trial of either of the paid plans.
3. Site24x7
Site24x7 is a SaaS-delivered monitoring service. It can monitor resources on the cloud or on-premises and it specializes in backend functions down to hardware monitoring.
A subscription to Site24x7 Infrastructure is a flexible package of monitoring credits that include networks, servers, and services monitoring. The plan includes the ability to monitor up to 10 hosts and there is an allowance of one integration per host. The Elasticsearch monitoring functions of the service are packaged as an integration. You don’t have to apply the same integration to each host that you monitor.
The integrations library of Site24x7 includes a plugin for Elasticsearch and another for AWS Elasticsearch. Each of these adds extra screens to the dashboards. They monitor activity by Elasticsearch plus memory issues and JVM performance. The Elasticsearch features that the monitor looks at include cluster statuses, memory activity, storage requirements, and document access. It checks on read and write activity for response times and throughput and it identifies search metrics related to indexing, query efficiency, and thread pool performance.
You can also see server-related performance issues through this system. This will observe orphaned and hanging processes and the potential for processor and memory shortages. The Elasticsearch monitor identifies maintenance activities performed by the application’s management system, such as backup process and memory release.
The Site24x7 system includes performance thresholds that trigger alerts when breached. Alerts can be sent out to technicians by email or SMS. The service also includes application dependency mapping for rapid root cause analysis.
Site24x7 is available on a 30-day free trial.
4. Dynatrace
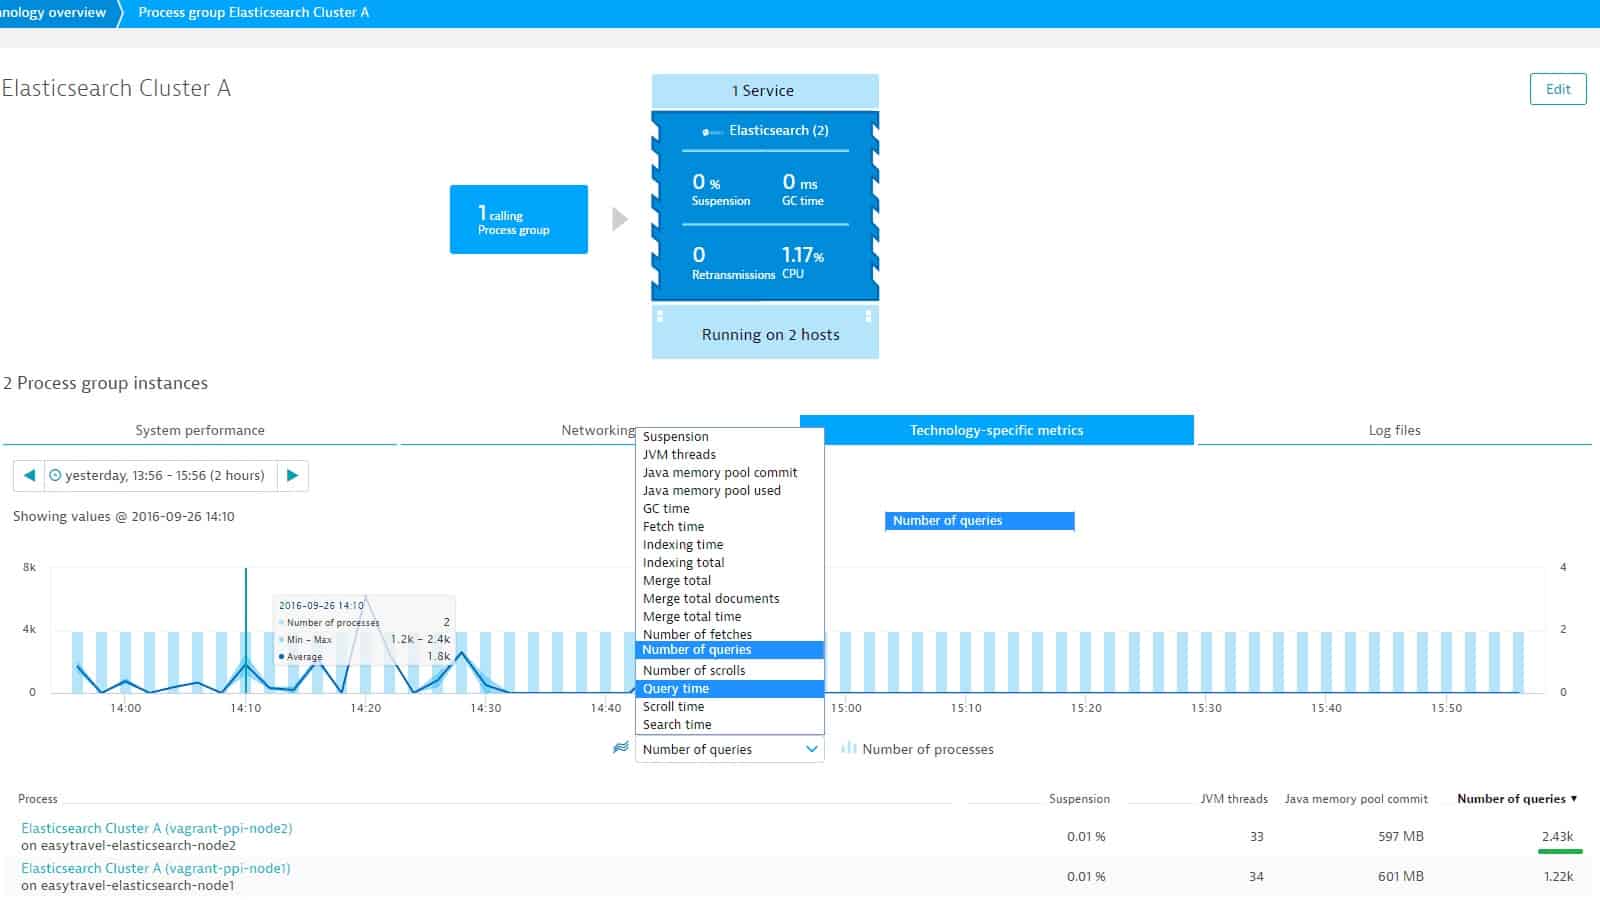
Dynatrace includes AI techniques and task automation to speed up system monitoring tasks and reduce the involvement of operations team technicians in performance problem-solving. This system has special functions for monitoring Elasticsearch and Amazon Elasticsearch.
The system includes a discovery function that will connect to all of your instances and install monitoring agents. This creates an overview of performance in the Elasticsearch screen of the Dynatrace dashboard. The operations of individual instances can be examined through a drill-down path.
The discovery function ripples through all of the applications and services that you operate. All of these will be registered in the dashboard and come under the supervision of Dynatrace automated processes. This makes the service very easy to set up.
The application tracking service includes the creation of an application dependency map. This is an AI-supported service that is constantly updated. It prepares background information to speed up root cause analysis if performance issues are detected in any service or application.
The Elasticsearch monitoring services in Dynatrace cover Elasticsearch clusters, their memory allocations, and interactions with server resources. It also examines a number of shard-related metrics. It looks at indexing, query efficiency, availability, and response times. It tracks JVM and thread pools as well.
The Dynatrace monitoring system sets expected performance levels on each factor that it monitors. These are constantly tweaked through a machine learning process in order to reduce the number of false alarms. If performance deviates from that expected standard, Dynatrace generates an alert and sends it out as a notification in the form of an email or SMS message.
Dynatrace is a subscription service and it is tailored in a number of plans. The Full-stack Monitoring edition includes the ability to monitor Elasticsearch. This also includes performance monitoring for applications and underlying services. Dynatrace is available for a 15-day free trial.
5. ManageEngine Applications Manager

ManageEngine Applications Manager is a thorough monitor for applications, services, and server resources. It is an on-premises system but it isn’t limited to monitoring the activities of its host. It can access other servers across a network, monitor remote sites over the Internet, and check on cloud resources.
This monitoring service approaches Elasticsearch supervision from a use-case angle. That means that it links the performance expectations for the search facility to the context of the service that it is working on. For example, when Elasticsearch is used for log analysis. The system looks at availability and response times for all instances and then it gives a drill-down to examine each implementation.
The use-case modeling of Applications Manager is closely linked to its application dependency mapping service. This is an automated process that searches out all of the applications and services running in a system and identifies the links between them. This is a great tool for root cause analysis. Applications Manager operates a system of performance thresholds that trip alerts if crossed. Alerts can be sent out as notifications by email or SMS.
Internal activities are tracked, such as query response times and resource usage. Memory is a particularly big issue with Elasticsearch and the Applications Manager examines cache, JVM memory, and index spaces to ensure that memory services don’t cause Elasticsearch’s performance to hit limitations. The data search engine’s cluster and node management and server resource usage are also tracked.
Applications Manager installs on Windows Server and Linux. It is packed in three editions. These are Free, Professional, and Enterprise. The Free version is limited to five monitors. The Professional edition is for a single site and the Enterprise edition can unify the monitoring of multiple sites. Applications Manager is available for a 30-day free trial.
6. Opsview
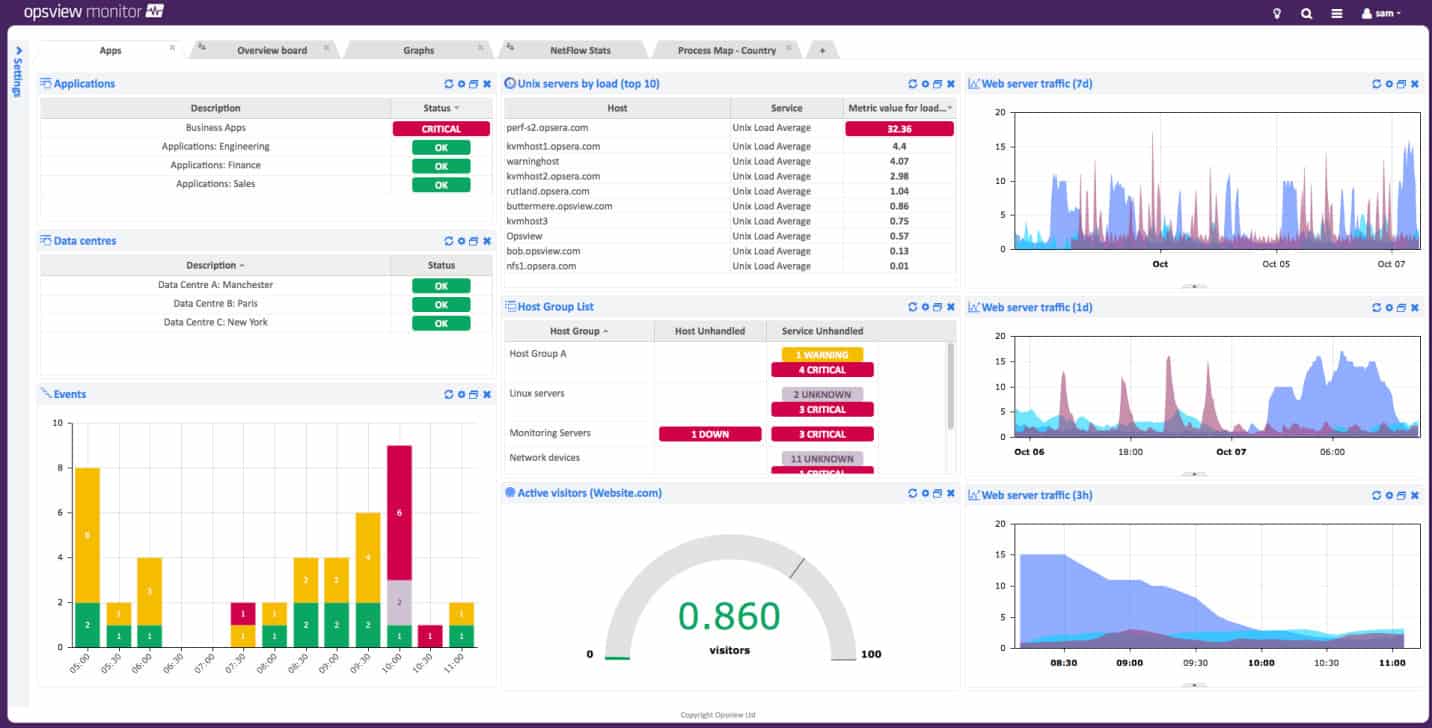
Opsview is a system monitoring tool that can be run on-premises or accessed as a SaaS platform. The base package of Opsview can be extended by plugins, which are called “opspacks.” There is an opspack for Elasticsearch monitoring.
The system will enroll all of your Elasticsearch implementations and consolidate performance metrics in an overview screen. You then have the option to drill down and check out each instance individually.
The Elasticsearch monitoring system in Opsview tests for the availability of Elasticsearch instances and their overall response times.
The Opsview system will display statistics on clusters and nodes and also monitor JVM and server resource performance and availability. The service particularly focuses on the different types of memory that Elasticsearch needs.
Opsview compiles an application dependency map. This is repeatedly rechecked to include any new relationships. This paves the groundwork for rapid root cause analysis if performance issues arise anywhere in the system – not just in Elasticsearch.
The Opsview monitoring system raises an alert if resources run short or if performance drops. These conditions trigger notifications to technicians and kick-off system problem identification routines.
Opsview is offered in three editions. These are SMB, Enterprise, and Opsview Cloud. SMB is tailored to small businesses and Enterprise is for larger organizations. Both of these plans are on-premises packages for installation on Linux servers. Opsview Cloud is a hosted SaaS system. All versions have the same functions and can be expanded by the Elasticsearch opspack. Ask for a demo of the cloud service.
L’article 6 Best Elasticsearch Monitoring Tools est apparu en premier sur Comparitech.


0 Commentaires