
A protocol analyzer provides details of the information inside the headers of data packets as they move around a network. The detection task is also known as “packet sniffing”.
The details in a packet header include the source and destination address of the traveling message and part of this address is the port number.
By listing the port numbers on packets, a protocol analyzer can provide application-specific details of network activity.
Here is our list of the six best protocol analyzer tools:
- SolarWinds Network Performance Monitor (FREE TRIAL) This network monitoring package includes a protocol analyzer as part of a deep packet inspection facility. Runs on Windows Server. Start a 30-day free trial.
- Wireshark This is the leading protocol analyzer and one of the oldest. If you take a course on network analysis or cybersecurity, you will use Wireshark in the lab. Available for Windows, macOS, and Linux.
- Paessler PRTG This is a bundle of monitoring tools for networks, servers, and applications and it includes a packet sniffer that has a protocol analyzer in its user interface. Runs on Windows Server.
- Snort This traffic analysis tool is known mainly as an intrusion detection system but it includes a protocol analyzer. Available for Linux, Unix, and Windows.
- Splunk this data analyzer is widely used for searching through data and it can be fed a pcap file to make it a protocol analyzer. Available for Windows, Linux, Unix, and macOS.
- Omnipeek Network Protocol Analyzer A live traffic analyzer that can also be used to perform searches through historic data analysis. Runs on Windows.
You can read more about each of these options in the following sections.
Port numbers and protocols
In network parlance, a “port” isn’t a physical receptor on the side of a device; it is a logical identifier that creates an address. The concept of logical ports is part of the suite of TCP/IP protocols and it is found at the Transport Layer of the stack. Ports are identified as being used for TCP or UDP, while many are used for both.
A global organization, called the Internet Assigned Numbers Authority (IANA), maintains a list of assigned port numbers. Numbers are allocated to specific applications, which are also called protocols.
The purpose of the IANA list is to provide a universal list of protocol identifiers. The assignments don’t belong to any individual business. This means that no one gets an advantage over control of port numbers. The value of this universality is that software developers working independently can create compatible systems that can send and receive data without having to reach agreements with all of the other software developers in the world.
Anyone can get access to the list of assigned port numbers. IANA maintains a list of ports but it isn’t very well presented. You can get a better table of port numbers at other websites, such as the Wikipedia page on port numbers.
The full range of port numbers is subdivided into sections:
- Well-known ports: 0 – 1023
- Registered ports: 1024 – 49151
- Ephemeral ports: 49152 – 65535
The difference between these ranges is that the well-known ports are the oldest allocations and represent long-standing protocols, such as the File Transfer Protocol (FTP) and the Simple Mail Transfer Protocol (SNMP).
While well-known ports are almost all used for open-source standards, the registered ports are assigned to services that companies might have developed. However, open-source protocols are also assigned numbers in this range because there are no spare numbers left in the well-known ports range.
Ephemeral ports are deliberately unregistered and IANA won’t assign numbers in this range. Non-official lists of port numbers will include usage guidance for port numbers in this range where the regular use of one of these port numbers has been coded into a piece of widely-used software.
One of the main uses of ephemeral ports is to allow concurrent connection management. In this scenario, a software package might signal to a correspondent that the connection should continue on another port, thus freeing up the well-known port for connections from other clients.
Packet capture and protocol analyzers
Protocol analyzers need data to analyze. This data is a stream of packets that are collected from a network. The protocol analysis task is not the same as packet capture – they are two separate functions. A protocol analyzer doesn’t just operate on live data because packets can be read in from files for analysis.
The best protocol analyzers include an integrated packet capture system. However, that packet capture process probably isn’t built into the protocol analyzer. The most widely used system for packet capture is pcap and this is implemented for Unix and Unix-like operating systems, including Linux and macOS, through libpcap. Windows users need WinPcap. These systems are free to use.
The best protocol analyzer tools
Protocol analysis based on packet captures is one of the oldest network troubleshooting techniques around. There are many long-running protocol analyzers available that are free to use. Although these systems are free and old, many of them are still leading the industry because they have been adopted by large network system providers and funded, while still being kept free to use.
What should you look for in a protocol analyzer tool?
We examined the market for protocol analyzers and assessed the available options based on the following criteria:
- An integrated packet capture tool, such as libpcap and WinPcap
- Options to laugh packet capture from the analyzer
- Filters for packet capture and display
- Color coding for different protocols
- An indication of conversations or related streams
- A free tool or a free trial for a paid tool so that assessment can take place without payment
- Value for money that is provided by a paid tool that is worth its price or a free tool that works well
With these criteria in mind, we identified free and paid protocol analyzers, looking as well for wider system monitoring packages that include a protocol analyzer as an extra service.
1. SolarWinds Network Performance Monitor (FREE TRIAL)
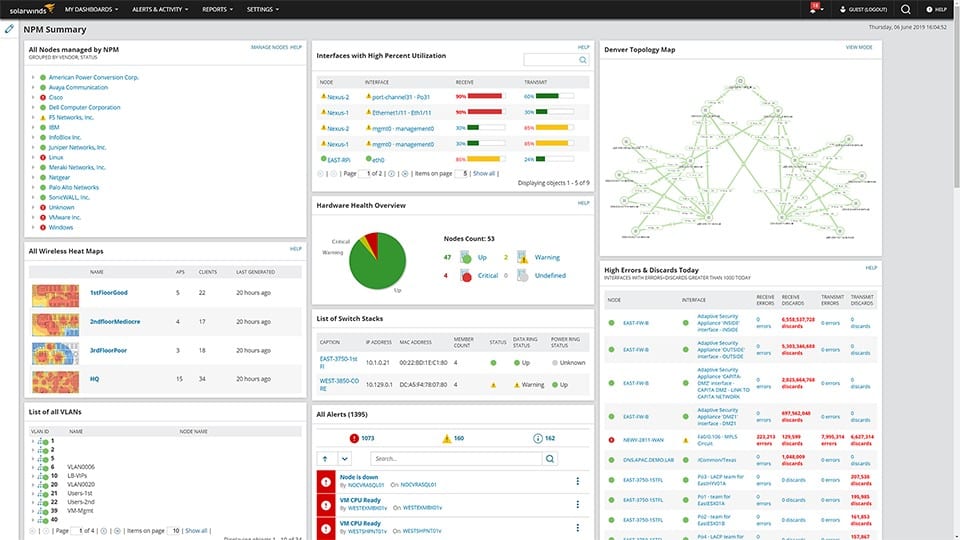
SolarWinds Network Performance Monitor is a leading network monitoring system with many utilities. One of the tools in the SolarWinds package is the Deep Packet Inspection service. This enables you to slice all network performance metrics by application. The applications referred to by SolarWinds are protocols and this is derived by looking at the port numbers in passing packets.
Key Features:
- Traffic statistics per application
- Categorizes traffic by usage
- Summarizes packets per endpoint
- QoS statistics
A big advantage that this solution has over the other tools in this list is that it isn’t a standalone protocol analyzer; it is part of a much bigger set of network monitoring tools that includes an autodiscovery service, a network inventory creator, and a network topology mapper.
The user interface for the Network Performance Monitor is very sophisticated and presents a lot of graphical representations of traffic data as well as lists. The screens are well laid out and make data interpretation easy. The tool doesn’t include a data viewer for manual traffic analysis.
Pros:
- Easy to use with well-presented data screens
- Alerts for unusual traffic patterns
- Categorization of traffic for business or personal use
- Quality of Experience (QoS) measurements
Cons:
- No manual data analysis facility
The software for SolarWinds Network Performance Monitor installs on Windows Server and you can assess the system with a 30-day free trial.
2. Wireshark
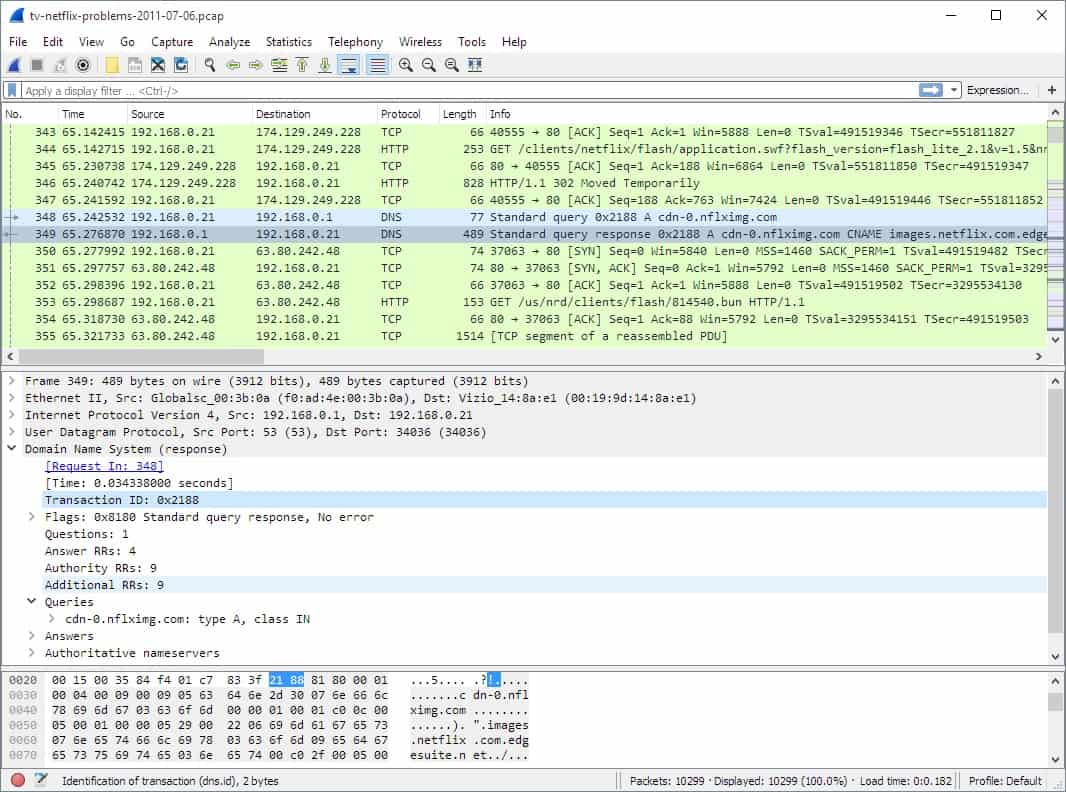
Wireshark ticks all of the boxes to be a great protocol analyzer: it integrates a packet capture system, it color codes protocols and it gives a range of quick options to filter packets through a right-click menu. What makes Wireshark even better is that it is free to use.
Key Features:
- Easy to install and use
- Graphical user interface
- Start and stop packet capture
- Query language
- TCP stream tracking
The Wireshark system doesn’t have its own packet capture routines, but it works seamlessly with WinPcap and libpcap. The installer for Wireshark downloads and installs the right pcap version for you while it installs its own software. You start and stop packet capture with a button within the Wireshark interface.
Pros:
- Learning to use Wireshark gives network professionals a sought-after skill
- A comprehensive filtering command set for captures and data searches
- Options to store packets to file
- Command-line version, called Tshark
- Free to use
Cons:
- The query language is very complicated
Wireshark has its own query language with long lists of commands and data definitions. The big problem with the system is that the query language is very complicated – it takes training and a lot of time to be able to use it. Filters can be applied to packet capture that greatly reduce the volume of packets that are brought into the viewer. The user gets the option of whether to save captured packets.
3. Paessler PRTG
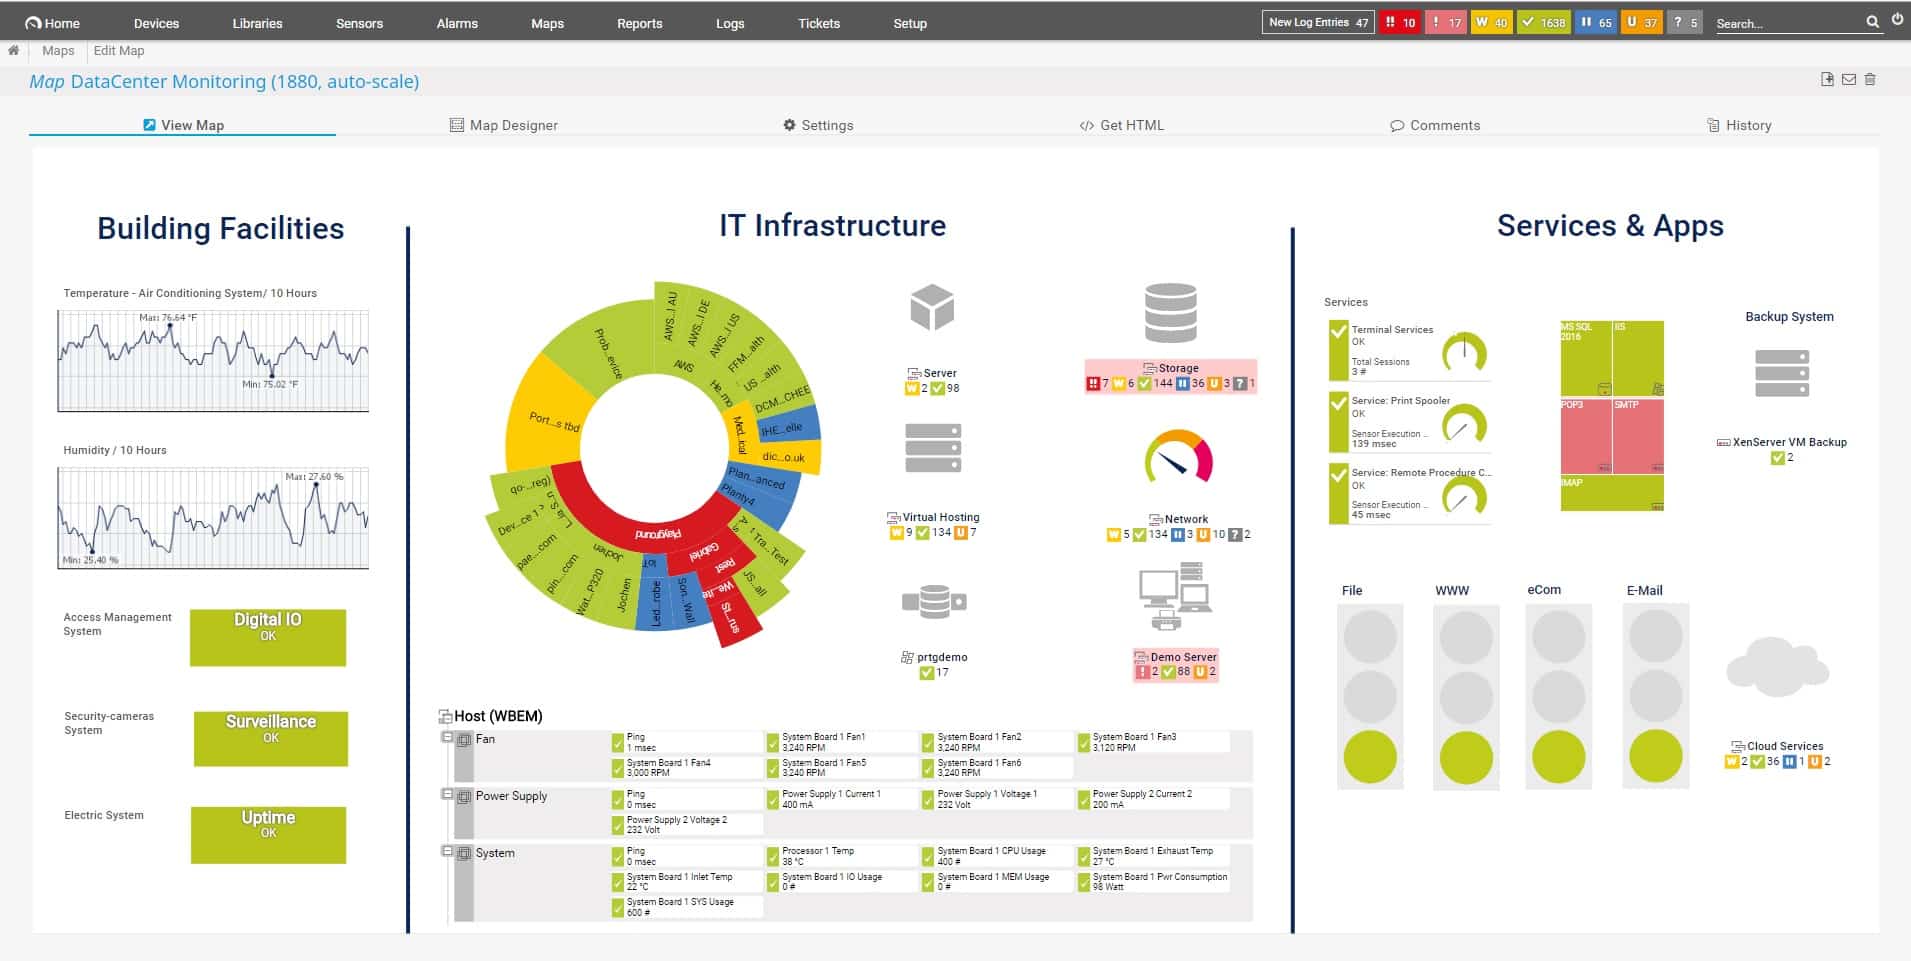
Paessler PRTG provides a choice of monitoring systems for networks, servers, and applications. The bundle includes a large number of monitors, which are called sensors. The price you pay for the system depends on how many sensors you want to turn on and then you choose which to activate.
Key Features:
- A choice of packet analysis techniques
- Graphical displays
- Throughput generator rankings
- Includes other network monitors
The PRTG sensor list includes a number that can be used for packet sniffing and protocol analysis. The straightforward packet sniffer will capture packets and display statistics about them. The screen or this sensor includes a ranking for top traffic generators per application, per device, and per conversation.
Other traffic analysis options come from bandwidth analysis systems, such as IPFIX, NetFlow, J-Flow, and SNMP. You can also switch to network performance screens to see whether any of the switches and routers on your network is experiencing problems.
Pros:
- Traffic analysis
- Displays traffic per protocol
- Link analysis
- End-to-end traffic analysis
Cons:
- Doesn’t include tools for manual protocol analysis
Paessler PRTG installs on Windows Server and you can use it for free forever if you only activate 100 sensors. You can get a 30-day free trial of the system with all sensors activated.
4. Snort
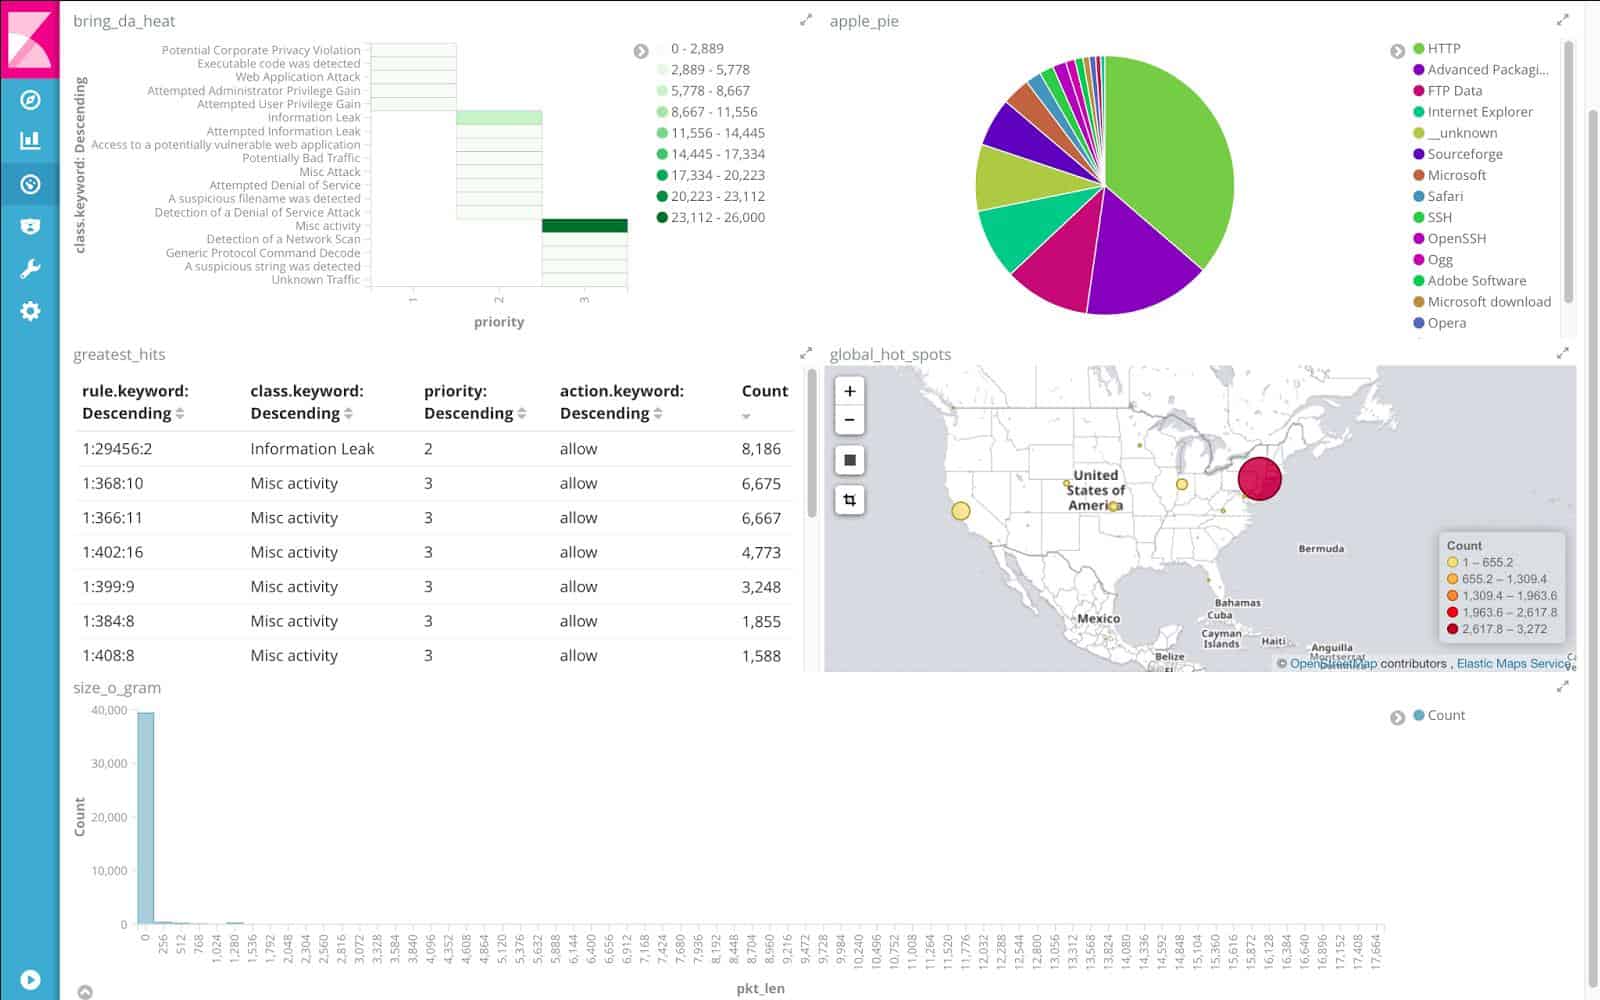
Snort is a well-known intrusion detection system. However, the package is a data analyzer and can be applied to several different applications, such as packet-level scanning and protocol analysis.
Key Features:
- Packet sniffing mode
- Packet display and searching
- Automated rules
Snort has a packet sniffing mode which is based on the pcap system. You don’t need to run libpcap or WinPcap separately because Snort can integrate with those tools to read packets directly from the network.
Snort’s key strength is its automated searches which are implemented by rules. You can acquire rules yourself or write them yourself. With these rules, you can create your own alert conditions and let Snort operate as a live network performance monitor.
Pros:
- Automated searches
- Customizable filtering and detection rules
- Customizable alerts
Cons:
- This is a powerful system and it takes time to learn how to get the best from it
Snort is available for many Linux distros, BSD Unix, and Windows. The system is free to use but it becomes more powerful with a set of rules. You can get community-created rules for free and more powerful business-centered rule packs for a subscription.
5. Splunk
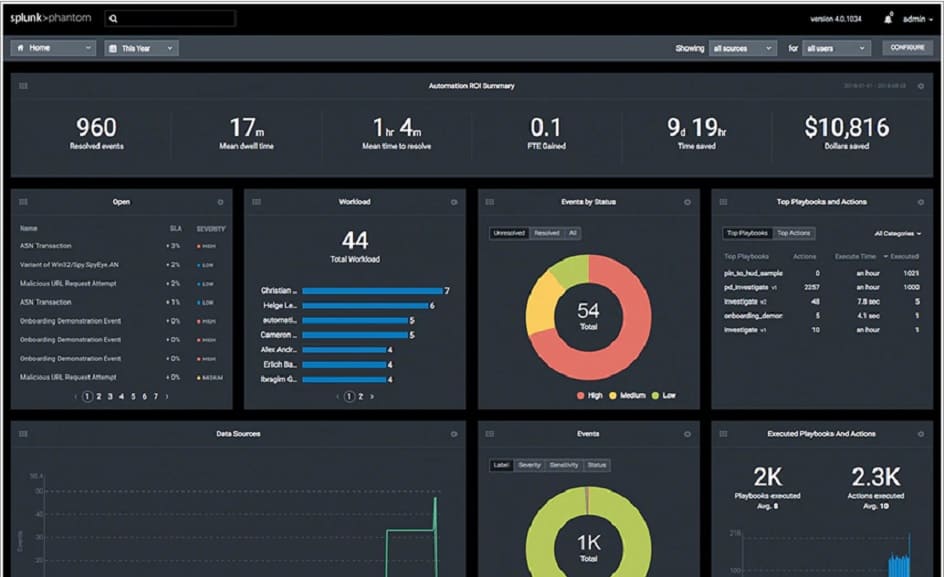
Splunk is a data analysis tool and it is available in both on-premises and SaaS versions. Although you can use Splunk to create any data search, creating your own analysis applications from it, the tool has become more successful through the production of prewritten tools, especially Splunk Enterprise Security. This security package is a SIEM and it also offers a live port and protocol activity monitor.
Key Features:
- A SIEM system
- Adaptable to custom applications
- Analyzes any data
It is possible to use Splunk to look at packet data and identify protocol activity through a free plug-in. The community of users of Spunk includes an app marketplace, called Splunkbase. There is a package available on that forum called PCAP Analyzer for Splunk. This service is free to use and it provides a connector to read pcap files and a set of searches that place data in its own Splunk screens – there is a protocol analysis feature in this tool.
Pros:
- Adaptable for a range of customized applications
- A free plug-in for packet analysis
- A protocol analyzer
Cons:
- Runs off PCAP files rather than an integrated packet sniffer
Splunk Enterprise installs on Windows, Windows Server, Linux, Unix, and macOS, or you can access Splunk Cloud through any standard Web browser. Both systems are available for a free trial – 14 days for Spunk Cloud and 60 days for Splunk Enterprise.
6. Omnipeek Network Protocol Analyzer
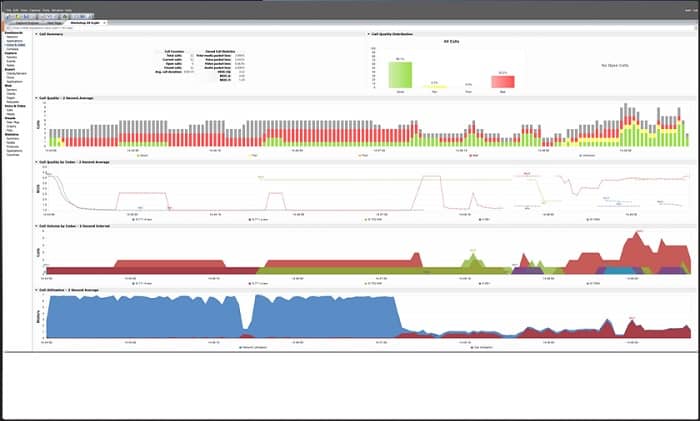
If you just want a pure protocol analyzer without lots of peripheral capabilities, then the Omnipeek Network Protocol Analyzer from LiveAction is probably your best bet. As the name suggests, this tool is all about tracking traffic by protocol and it does it very well.
Key Features:
- Focused on protocol analysis
- Live traffic throughput
- Graphical data representations
When you use Wireshark, you start with a screen full of packet contents and then filter out data so you get through the mass of available data to something of workable size. With Omnipeek, it’s the other way around because it starts with an overview and lets you click your way through to slices of data until you end up right down at the packets. This is a much more manageable way to approach traffic data because you only need to go down to a level of detail that explains the problems that your network is experiencing.
If your technical skills are not that great and you don’t want to have to learn a whole programming language to get something meaningful to appear on the screen, then you will like the Omnipeek Protocol Analyzer a lot.
Pros:
- Easy-to-read screens
- Displays live traffic data
- Offers drill-down details
Cons:
- Doesn’t do much else other than protocol analysis
Omnipeek Protocol Analyzer is an on-premises software package that installs on Windows Server. The tool can gather packets itself, so you don’t need to set up a separate PCAP service and feed it files. The system can analyze wireless networks as well as LANs. Examine the capabilities of Omnipeek Protocol Analyzer with a 30-day free trial.
L’article 6 Best Protocol Analyzer Tools est apparu en premier sur Comparitech.


0 Commentaires