
For a free, open-source, community-supported system, MariaDB has some very strong development talent backing it. MariaDB is a fork of MySQL and it was created in 2009 as a response to Oracle Corporation taking over Sun Microsystem and therefore, acquiring the free-to-use MySQL. The original creator of MySQL was worried that Oracle would make MySQL commercial-only and so copied the entire system and gave it the name MariaDB.
Oracle Corporation wasn’t as greedy as its opponents feared it would be. Therefore, MySQL is still very widely used, especially for website databases. This continued free availability of MySQL has possibly reduced the growth of MariaDB. MySQL outranks MariaDB in a number of implementations to a great degree.
The similarity between MySQL and MariaDB makes it very easy to port applications from one system to the other. Another name to look out for is SkySQL, which is a hosted version of MariaDB. Amazon RDS offers MariaDB support. So, when you are looking for a MariaDB monitoring tool, the probability is that the system will also monitor these related systems.
Here is our list of the six best MariaDB monitoring tools:
- AppOptics EDITOR’S CHOICE This is a cloud-based infrastructure and applications monitor that includes monitoring procedures to track the performance of relational databases, including MariaDB. Start a 30-day free trial.
- Datadog A cloud platform that offers a range of monitoring tools and the Infrastructure module covers services and the servers they run on. This service will identify all of your services and, with an integration, keep a close eye on MariaDB
- ManageEngine Applications Manager This comprehensive application monitor watches over services and servers. It includes processes for MariaDB performance tracking. It installs on Windows Server and Linux.
- Site24x7 Infrastructure This cloud-based package of monitoring services allows you to observe the full stack and put its MariaDB performance tracking into a system-wide context.
- Opsview A system monitor with a plugin for specialized MariaDB monitoring capabilities. It is available for installation on Linux or as a cloud-based service.
- LogicMonitor A flexible cloud-based monitoring tool that includes AI processes and has MariaDB monitoring capabilities.
Database monitoring considerations
The current structure of the IT industry is very diverse. The creation of cloud services means businesses take on subscriptions to bundles of applications and services, choosing a specific headline system, not paying attention to the backend systems that support it. As a result, it is very likely that a typical business has many different services hosting in geographically dispersed locations to monitor and they could very well all have different DBMSs supporting them.
It isn’t unexpected that you have a mix of DBMSs even if you made a corporate decision to use MariaDB for your in-house development. Although this guide is focused on monitoring tools for MariaDB, getting a system that is able to monitor other DBMSs as well is a big help.
The best MariaDB monitoring tools
When looking for MariaDB monitoring tools, we focused on systems that had a wide range of capabilities, not those that only monitor MariaDB. This will save you a lot of money because you won’t need to buy other monitoring systems whenever you discover that some online service you subscribe to actually has a different DBMS behind it.
Luck favors the prepared, so having the capability to monitor many different DBMSs means that your business is ready for anything. You don’t want to wade through very long menus of service that you don’t need and you don’t want to have to install a very large software package that has all of the code to monitor databases that you might not use in the future.
The ideal database monitoring system is one that allows you to add on the capability of monitoring a specific DBMS, so you end up with just those screens you need to monitor the systems that you know you have. Of course, the database monitors that made it onto our list all have MariaDB monitoring capabilities.
1. AppOptics (FREE TRIAL)

AppOptics by SolarWinds is a cloud-based application performance monitor. This monitoring service can watch the performance of on-premises and SaaS systems and it can unify the monitoring of all systems no matter where they are hosted. This service has database monitoring capabilities, which include performance tracking for MariaDB.
The base package of AppOptics covers standard services and applications and is also able to check on server resources. You need to add on the capability to monitor MariaDB. However, the procedure to activate the MariaDB plugin is very straightforward and the extra modules are free. The module for MariaDB monitoring is actually a MySQL add-on. However, it works just as well with MariaDB instances.
The MariaDB service monitors about 60 factors. These are measured from within the database and cover a range of factors including actual query activity and administration actions. The monitor also checks on the resources of the host for your database and looks out for resource shortages.
AppOptics is a subscription service and it is offered in two editions. The lower of these is called Infrastructure Monitoring and this includes the MariaDB capabilities. So, it is all you need to monitor your databases. The higher plan is called Infrastructure and Application Monitoring. SolarWinds offers AppOptics on a 30-day free trial.
EDITOR’S CHOICE
AppOptics is our first choice for monitoring MariaDB! We particularly like how it automatically builds an application dependency map that supports root cause analysis for performance problem-solving. SolarWinds AppOptics includes an alerting mechanism that triggers email and SMS notifications to technicians if problems arise.
Start 14-day Free Trial: https://my.appoptics.com/sign_up
OS: Cloud-based
2. Datadog Infrastructure
Since the Datadog platform is based in the cloud it is able to monitor systems anywhere. So, whether you are looking to monitor your local site, remote sites, or cloud resources, this tool should be of interest. It can even combine the monitoring of resources located in different locations – including the cloud – to create a system-wide overview.
The Datadog Infrastructure module can be expanded by a library of 400 free plugins, called “integrations.” There is an integration available that adds on MariaDB monitoring capabilities. As well as the integration for monitoring your on-premises MariaDB instances, the integrations library offers a special plugin to monitor Azure DB for MariaDB and another for AWS RDS.
The core of the Datadog Infrastructure package monitors those applications and services that support user-facing software and it also keeps track of the availability of server resources. The abilities of this monitoring system extend to virtual systems and cloud resources. This service includes databases, such as MariaDB. The monitor can also track the performance of many other database management systems and provide you with a single console to supervise all of them.
The MariaDB monitor collects statistics on more than 80 database statuses. These include query performance data taken from within operating instances. The monitor assesses issues such as cache performance and disk interactions when it examines how the database interfaces to server resources. It can also track the availability of capacity to account for typical requirements of the running database.
The Datadog Infrastructure system is able to use machine learning to apply thresholds that predict typical performance levels and identify when a potential resource shortage could impair performance.
By tracking all of the applications that access the database, Datadog creates a dependency map – this feature is called Correlations and it is based on AI processes. The Correlations service is a preparatory system that sets up paths of investigations when applications start to perform badly. This speeds up root cause analysis and buys you time to take evasive action.
The alerts that Datadog Infrastructure generates can all be sent out to technicians as notifications by email or messaging system. So, everyone can leave the monitoring of MariaDB and other services to the automated processes of the Datadog system.
Datadog Infrastructure is packaged in three editions: Free, Pro, and Enterprise. The Free service will only monitor up to five hosts. The Pro has all the monitoring services that you need to support MariaDB databases. The higher-level features of Datadog Infrastructure, such as Correlations and machine learning for performance thresholds are reserved for the Enterprise plan. You can get a 14-day free trial of either of the paid plans.
Datadog Infrastructure is also great for MariaDB monitoring because it covers the performance of queries within the database as well as factors related to resources needed by the database management system. This tool is able to monitor MariaDB instances running on cloud platforms as well as those instances that you have running on your own servers. It can even consolidate the reporting on a mix of on-site and SaaS databases.
Get a 14-day free trial: https://www.datadoghq.com/dg/monitor/mariadb/
OS: Cloud-based
3. ManageEngine Applications Manager

ManageEngine Applications Manager is an application and server monitor that has very broad capabilities. MariaDB is among the systems that this service can monitor. The software package will monitor the server on which it is hosted, other servers on the same site, servers on remote site, and also cloud resources.
As with the AppOptics service, the MariaDB monitoring sensor used by Applications Manager is for both MySQL and MariaDB. The similarities between these two DBMSs are so great that a query written for one will run in the other. Using the same code for both of these systems cuts down the amount of space needed for the full monitoring suite.
The MariaDB monitoring system collects statistics on a large number of factors, including identifiers for the database instances and information about the database’s size and objects. This data creates an entry in the dashboard for that instance, with a page full of statistics about it. The statistics gathered about the database instance include memory and cache usage, disk accesses, response times, request rates, resource locks, query operational metrics, and replication information.
The data processor in Applications Manager is able to collate usage statistics about the most active users, calling applications, and queries. If you have many MariaDB instances, an overall performance page shows aggregated activity data from all of them. It is then possible to drill down to individual instances for detailed information on operations.
The Applications Manager tracks all of the services and applications that access each MariaDB instance. This is part of an automated discovery system that identifies links between systems and creates an application dependency map. This map is constantly updated and it serves as a basis for root cause analysis when things go wrong.
Applications Manager can be installed on Windows Server or Linux. It is offered in three editions: Free, Professional, and Enterprise. The Free version is limited to five monitors. The Professional edition covers a single site and the Enterprise edition will monitor multiple sites. Applications Manager is available for a 30-day free trial.
4. Site24x7 Infrastructure
Site24x7 is a cloud-based monitoring service. This is another monitoring system that doubles up its MySQL sensors to monitor MariaDB as well. The MySQL/MariaDB service needs to be added to the base package of the monitoring system. This extends the dashboard of the service, adding extra screens for database monitoring.
The MariaDB monitor looks inside each database instance and assesses its structure. It makes notes on the types and numbers of objects and records this information on a details screen in the dashboard. It will then continuously monitor actions such as memory and cache activity, disk interactions, and network interface activity. It counts all queries as they occur and identifies the user account and source for each request.
The monitor also checks on DBMS administrative activities, such as replication. It will give a rundown of top query targets and sources for each instance and also aggregate all of the statistics that it gathers for an overview of the performance of all instances.
Site24x7 sets performance thresholds that trigger alerts when crossed. Those alerts can be sent out to technicians by email or SMS. This notification allows data center staff to assume that the MariaDB database instances are all running smoothly because they will be drawn back to the console by a notification if problems are building.
Site24x7 Infrastructure is a subscription package that provides an allowance for a range of services, which include network, server, and application monitors. You are only allowed one add-in per server. However, if you need more, you can raise that limit for a fee. The standard subscription account is able to monitor up to 10 servers. You can try Site24x7 Infrastructure on a 30-day free trial.
5. Opsview
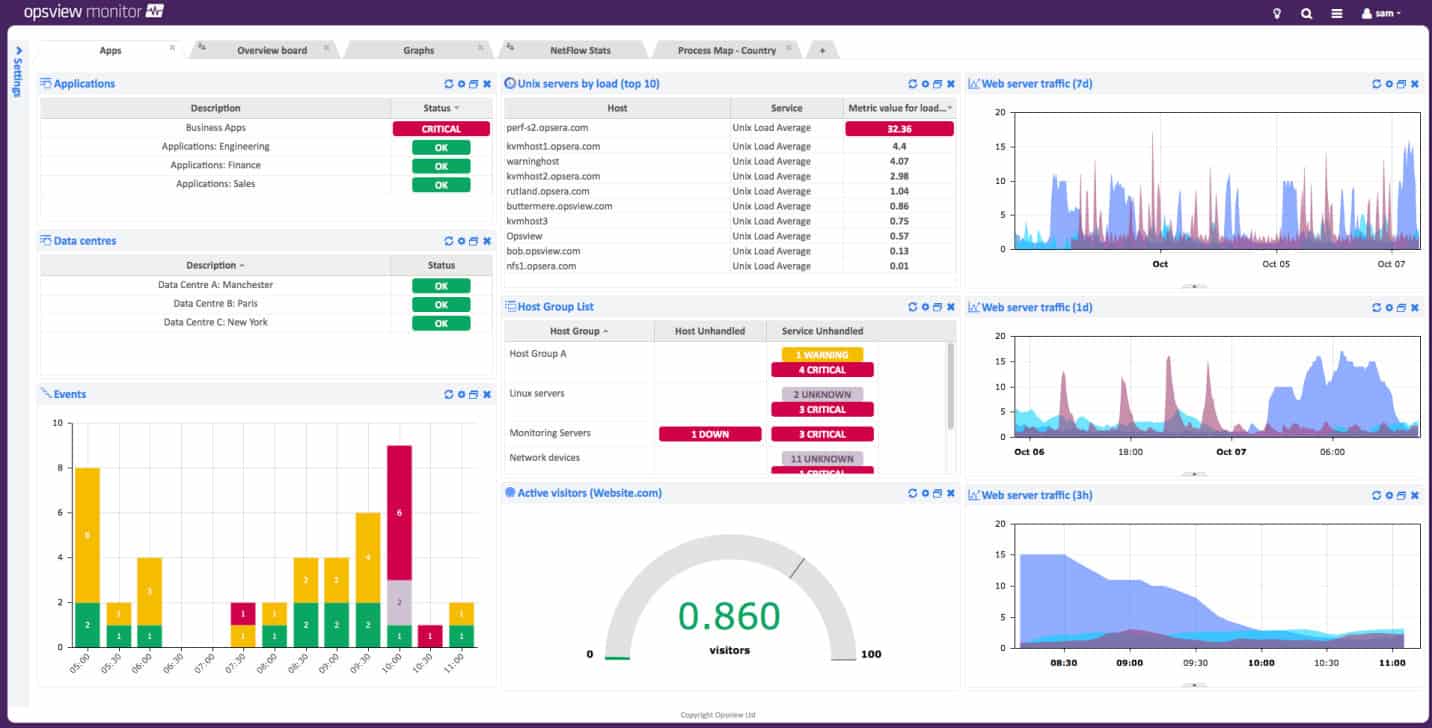
Opsview is an adaptable resource monitoring package that covers networks, servers, and applications. Its capabilities can be augmented by a library of add-ons, called “opspacks.” There is an opspacks available to monitor MariaDB. It is also possible to install Nagios plugins into Opsview.
The MariaDB opspack adds screens to the system dashboard and makes a data collecting agent available. This agent will collect information on replication and interactions with server resources. It also examines the performance of queries. It allows you to select a particular query and watch the variations in its execution performance over time. This is particularly useful for focusing on the performance of a critical database action.
Opsview is able to monitor other database management systems as well as MariaDB. It gives you a single console to monitor all IT resources. As well as monitoring your on-premises services, this tool can check on the performance of cloud resources. It is able to blend together services in overviews that cover resources located on your premises and in the cloud.
The Opsview system includes an autodiscovery service that explores your network and identifies all resources. This extends up to the logging of software and applications. The system scan is continuous, so it spots any changes you make to your infrastructure and updates its records automatically. It will also map VMWare structures. This means that the system sets itself up and keeps itself updated.
Opsview includes a performance threshold system for each of the metrics that it tracks. These trip alerts if crossed and those alerts can be sent out as notifications by email, SMS, or Slack message. The Opsview system creates a stack map and provides support for anomaly detection and root cause analysis.
Opsview plans are available in three editions: SMB, Enterprise, and Opsview Cloud. SMB is for small businesses and Enterprise is designed for larger organizations. These are both on-premises packages for installation on Linux servers. Opsview Cloud is a hosted SaaS system. All versions have the same functions and all will take the MariaDB opspack. Get a free trial of the cloud service.
6. LogicMonitor
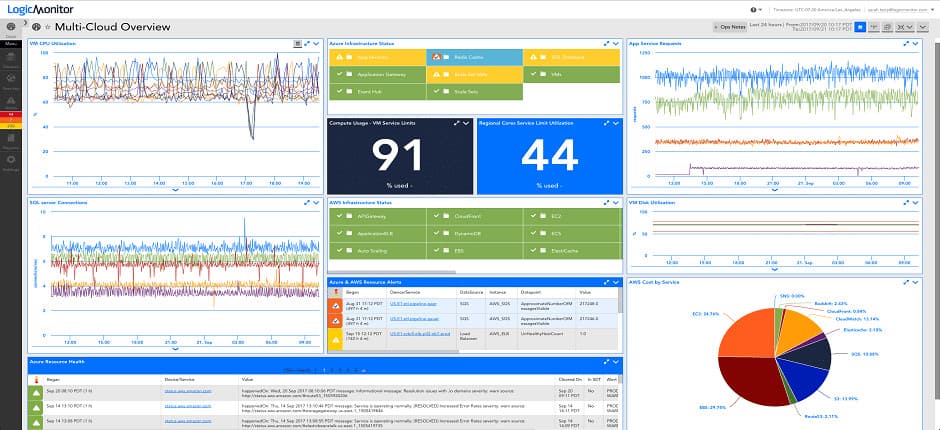
LogicMonitor applies its monitoring system for MySQL to MariaDB monitoring. This service is part of a cloud-based IT resource monitoring package that can be extended by integration. The MySQL service is one of a library of 2000 integrations.
The database monitoring service examines query performance, database management system activity, interactions with server resources and the network, and access by applications and users. All of the metrics that the service collects are displayed as graphs and charts in the dashboard.
The LogicMonitor service deploys AI to set performance expectations and it uses these to generate alerts if anomalies are detected. The system creates a full-stack view, crossing networks, servers, and applications and linking their dependencies. This speeds up root cause analysis for problems, which is also AI-supported.
LogicMonitor has a Core system and also a Website Monitor service – these are two separate packages and you only need the Core system to monitor MariaDB. This plan is available in two editions. These are called Pro and Enterprise – these have the same basic facilities but Enterprise will monitor more than 200 devices and includes the AI features of the service. You can assess LogicMonitor for a 14-day free trial.
L’article 6 Best MariaDB Monitoring Tools est apparu en premier sur Comparitech.


0 Commentaires