IBM’s Db2 is a family of database systems – it isn’t just one service. Among the Db2 range are a relational database management system, Db2 Warehouse, Db2 Hosted, Db2 BigSQL, and Db2 Event Store. Db2 is also available on AWS.
You might use several of those Db2 versions and have instances on different platforms all contributing to multiple services on your system.
Here is our list of the seven best IBM Db2 monitoring tools:
- SolarWinds Database Performance Analyzer EDITOR’S CHOICE This tool creates continuous monitoring for your Db2 instances and also provides optimization assistance. This is a cloud-based system with a 14-day free trial.
- Datadog Infrastructure A cloud-based monitoring service that tracks the performance of services that back up user-facing software and has a plugin for Db2 monitoring.
- Nagios XI A unified monitor for networks, servers, and applications that includes a Db2 sensor. It installs on Linux or over a hypervisor for Windows Server.
- Site24x7 Infrastructure A SaaS platform that offers system monitoring bundles and can be extended to perform DB2 health checks.
- ManageEngine Applications Manager A comprehensive package of application performance monitors that includes Db2 monitoring. It is available for Windows Server and Linux.
- Opsview An expandable system monitor that has an extension for Db2 monitoring. This is a cloud-based service.
- AppDynamics Database Monitoring A cloud-based monitoring service from Cisco Systems that includes Db2 performance tracking.
The best IBM Db2 monitoring tools
In our search for the best Db2 monitoring tools, we looked at a range of services from database optimizers to system-wide monitors that can link the monitoring of your Db2 instances with the services that support them and the applications that access them.
We also wanted to provide options for on-premises installation alongside SaaS tools delivered from the cloud. With this range of options, you can narrow down your search further according to whether you particularly need to monitor instances of Db2 running on your own servers or cloud-hosted databases.
1. SolarWinds Database Performance Analyzer (FREE TRIAL)
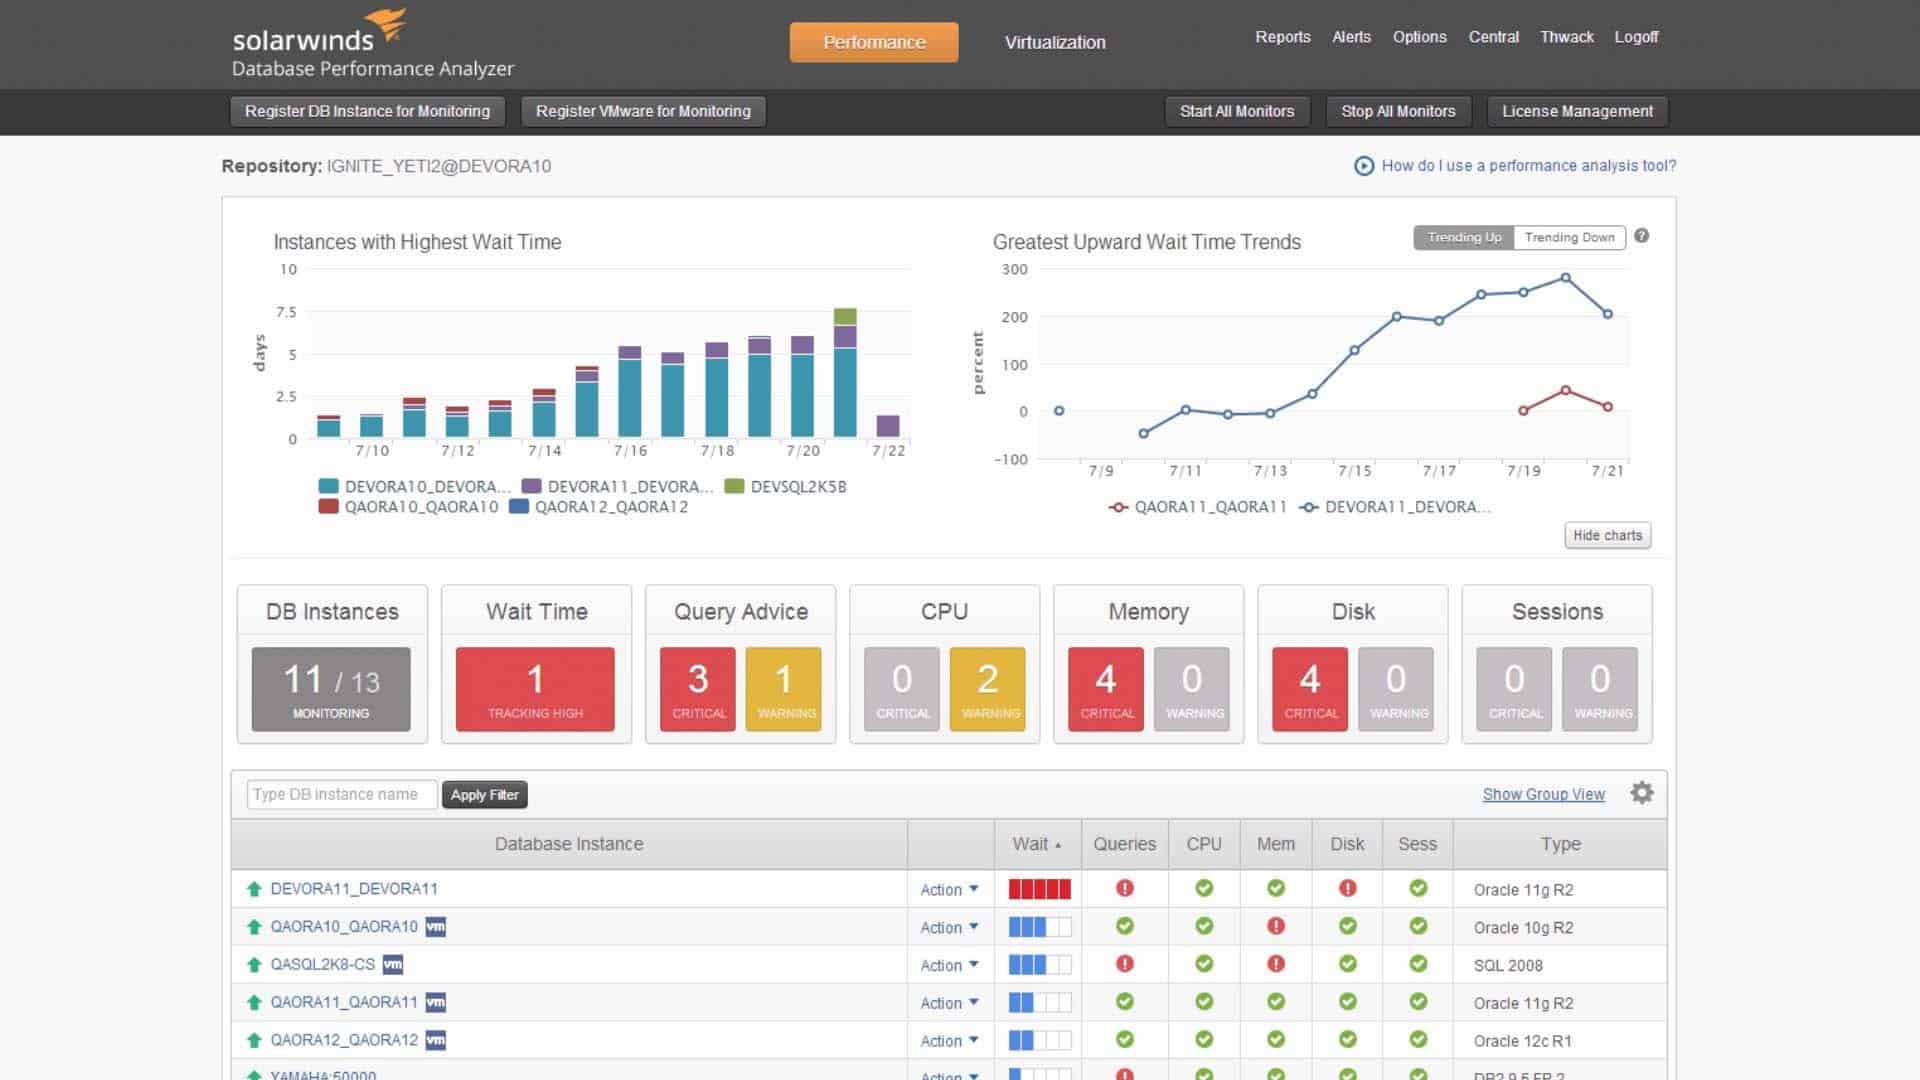
SolarWinds Database Performance Analyzer is a cloud-based service that monitors and tunes Db2 databases. It can access those databases no matter where they are hosted, whether on-premises, on the IBM Cloud servers, or on AWS.
The Database Performance Analyzer starts off as a core package. Subscribers choose from a list of database monitoring modules to set the system up. There is a Db2 integration available. Activating this integration adds on extra monitoring screens in the dashboard for the service. The system then sets itself up to start monitoring your Db2 instances.
This monitoring tool includes guidelines for database design. When it connects to a Db2 database instance for the first time, it assesses the database structure and produces a list of improvements. This is called Best Practices and this module will check all of your Db2 instances in turn, also checking operating system settings. The service will also assess the database replication strategy.
The output from Best Practices will give you work to get started with, adjusting the database. Meanwhile, the Database Performance Analyzer starts monitoring Db2 instance operations. The tool recommends factors to watch and the ideal performance ranges for each.
In the dashboard for the analyzer, you will see live performance data shown as time-series graphs. Those statistics also track operating system performance and resource availability. Live monitoring includes operating system resources as they support the database. The tool calculates the averages for each indicator through a machine learning process. Deviations from this expected range of performance are then marked as an anomaly and raise an alert.
The Database Performance Analyzer doesn’t just watch database tuning issues. It also monitors the accounts of users accessing the database and logs them. This is a useful service for security tracking.
SolarWinds Database Performance Analyzer is also able to monitor and tune Microsoft Azure SQL, MySQL, PostgreSQL, MariaDB, Oracle, SAP ASE, Redis, and Amazon Aurora databases
SolarWinds Database Performance Analyzer is a subscription service and you can experience it on a 14-day free trial.
EDITOR'S CHOICE
SolarWinds Database Performance Analyzer is our top pick for monitoring Db2 because it offers database management guidance and query optimizing tips as well as operating constant performance monitoring. This is a cloud-based service and I can monitor our DB2 instances wherever they are hosted. This system will also help you to improve all of your databases, including those of other DBMSs.
Get 14-day Free Trial: solarwinds.com/database-performance-monitor/registration
OS: Cloud-based
2. Datadog Infrastructure
Datadog is a cloud-based platform that provides system monitoring tools. The Datadog Infrastructure system watches the performance of all of the services that support user-facing applications. The tool can monitor systems wherever they are hosted and is able to unify the monitoring of cloud-based and on-premises resources in one overview.
The Datadog Infrastructure can be expanded through a library of 400 free plugins, called “integrations.” The library includes an integration for Db2 monitoring. As well as monitoring activity within the database, the tool identifies the applications that access each database instance. It examines locks, buffers, cache, disk interactions, and memory usage. It details each table, column, and index that gets accessed and makes this low-level data available for cross-referencing in the dashboard. These pieces of information build-up to provide rankings of the top accessing applications, the most access tables, and the most required fields in the database.
Information about applications accessing the Db2 instance feeds into an AI process called Correlations, which creates an application dependency map. This service is part of the Enterprise edition of Datadog Infrastructure, which is the highest plan of the service. The Enterprise edition also applies machine learning to create performance thresholds on database objects and resources.
Apart from the Enterprise edition, there are two other plans for Datadog Infrastructure and one of those is free to use. The Free edition is limited to monitoring five hosts. The other edition is called Pro. This includes the ability to monitor Db2 databases, but it doesn’t have the AI features of the Enterprise edition. You can get a 14-day free trial of either of the paid plans.
3. Nagios XI
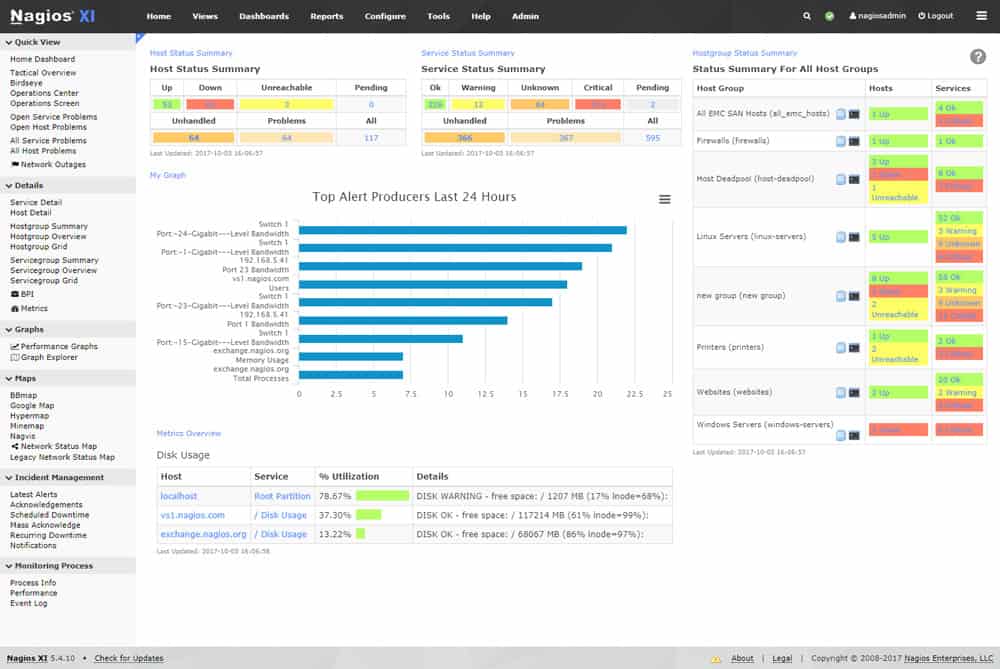
Nagios XI is a monitoring system for networks, servers, and applications. Its capabilities include the monitoring of Db2 databases. The wider capabilities of Nagios XI mean that you aren’t limited to monitoring just Db2 with this tool. It will also monitor your applications that access your Db2 instances and the servers that support them. It also offers network monitoring, so you get a full stack view with this tool of your entire IT system.
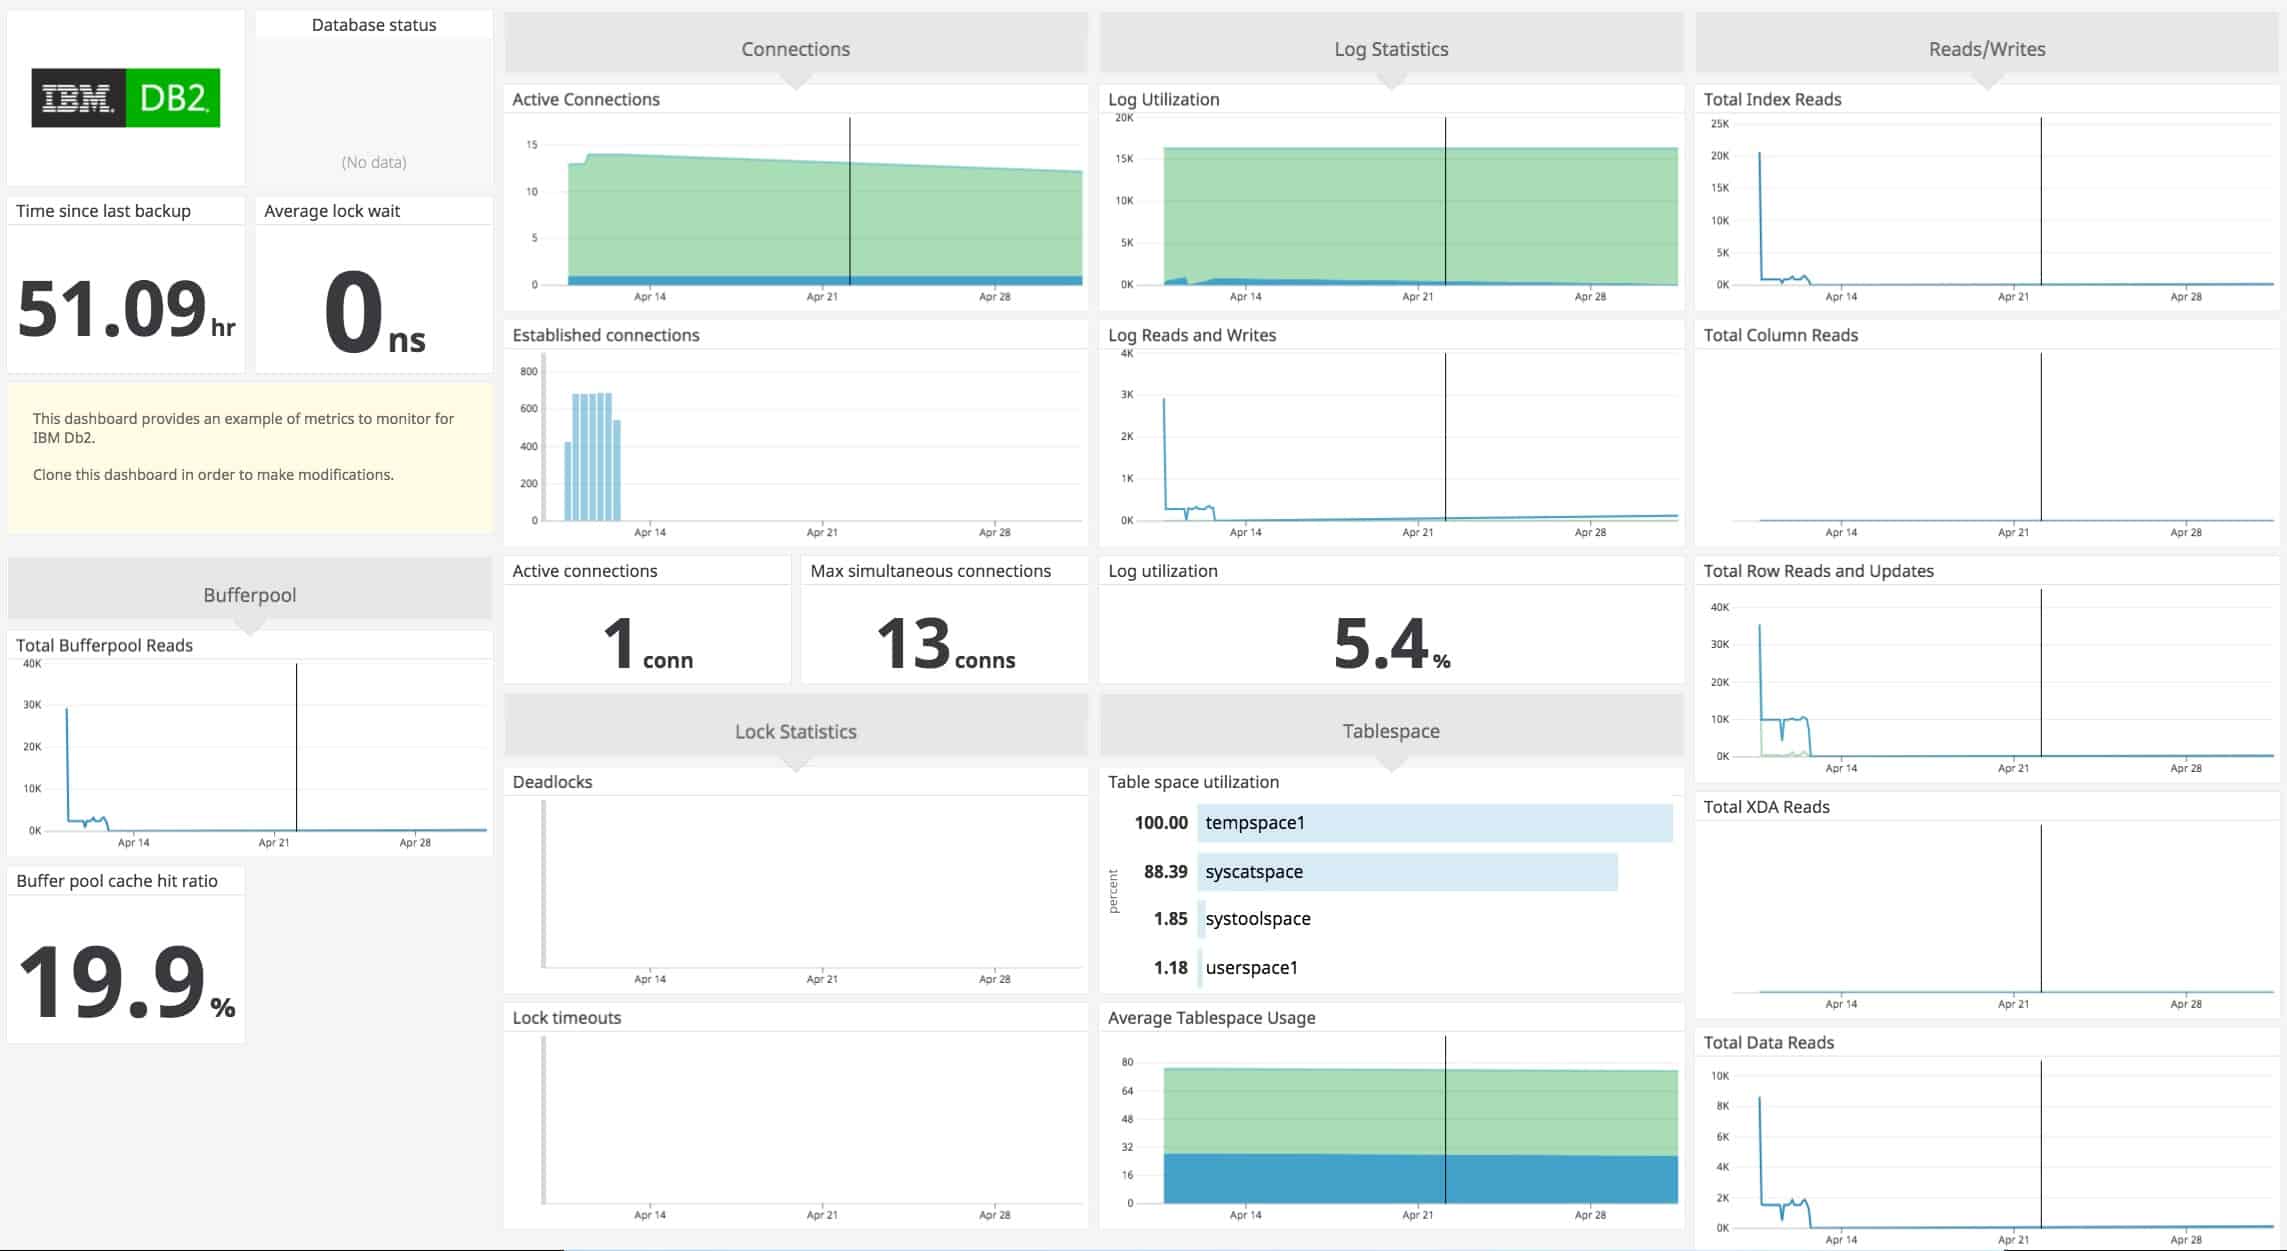
The Db2 monitor checks on database availability and response times. It watches issues such as tablespace size, total database size, cache ratios, and database object types and numbers. These basic metric monitors can be expanded by plugins.
The Nagios system has thousands of plugins available. These are provided for free by other users and also by product vendors. There are a number of plugins for Db2 in the community marketplace. These plugins work not only for Nagios XI but also for Nagios Core, which is the free version of Nagios.
The main difference between the Nagios Core and Nagios XI systems is that Nagios Core is community supported but Nagios XI comes with a professional support package. Both of these packages run on Linux. If you don’t have a Linux server and want to run the software on Windows, you can install it on top of a Hyper-V or VMWare hypervisor. Nagios XI is available for a 30-day free trial.
4. Site24x7 Infrastructure
Site24x7 is a SaaS platform that provides system monitoring services. The Infrastructure package includes a range of monitoring capabilities including network and server monitoring capabilities. The ability to monitor Db2 databases is contained in a plugin, which can easily be added to the package for free.
The Site24x7 Infrastructure plan includes the capacity to monitor 10 servers. Each server is allowed one free plugin. It is possible to use more than one plugin per server for a fee. In the Site24x7 terminology, a plugin is called an “integration.” However, it isn’t necessary to apply each integration that you need for all servers. So, if you use Db2 on one server, you only need that integration on that server and you can use different plugins on other servers.
The Db2 monitor tracks a list of factors on database activities. The dashboard that shows these live statistics also provides a forecasting service that gives projections of where demand on the database is going and how database size is expected to grow.
An alternative approach to benefit from the extensibility of Site24x7 Infrastructure is to install the Nagios integration. This allows all of the plugins available for Nagios XI to be added in without actually installing Nagios. That means that a single integration allowance can be used as a conduit for thousands of free Nagios plugins that can all operate simultaneously.
Site24x7 uses AI to set performance threshold levels. These thresholds trigger alerts when breached and those alerts can be forwarded by email or SMS. While tracking the accesses to each Db2 instance, the Site24x7 service builds up an application dependency map. This is a good foundation for root cause analysis should problems arise.
You can experience Site24x7 Infrastructure on a 30-day free trial.
5. ManageEngine Applications Manager
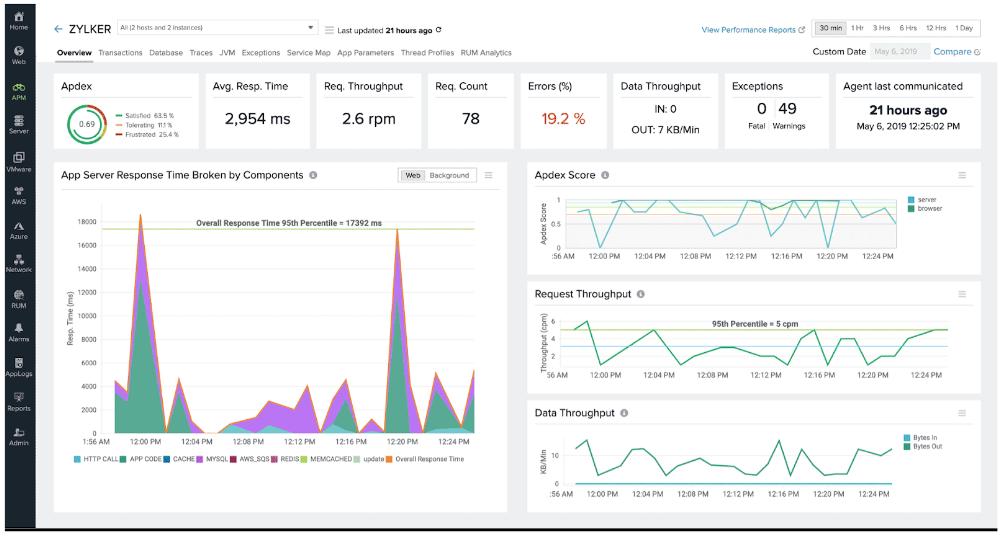
ManageEngine Applications Manager monitors the performance of applications and the servers that support them. This is a very wide-ranging package that has the ability to monitor a long list of applications. Db2 is on that list. The tool can monitor on-premises installations and also cloud-based Db2 instances – notably those available on IBM Cloud and AWS. The service will consolidate the monitoring of many Db2 instances and centralize the monitoring of multiple sites.
The DB2 monitor has its own screens in the dashboard of the Applications Manager. It tracks database information and identifiers, information about the size of objects, tablespaces and entire instances, connection statistics, details on agent performance, transaction statistics, cache, and memory activity, buffer statistics, and tablespace statuses.
The user can nominate a particular database query for special analysis. This service gives extra scrutiny to that query’s efficiency.
The Applications Manager tracks the availability and response times of all Db2 instances. Failure of connection to the database is one cause of alerts and notifications that are raised by the system. Other situations that will cause an alert to arise are resource shortages or performance deterioration.
The dashboard for the Applications Manager shows live performance data in graphs and charts. These screens can be customized and so can the performance thresholds that trip alerts. It is possible to adjust threshold levels or create composite conditions that observe conditions of several metrics.
The Applications Manager includes a system discovery tool, which searches for all active applications. It then examines the interactions between these applications. This includes noting which applications access each Db2 instance. This creates an application dependency map, which provides useful source material for root cause analysis when performance problems arise in the system.
ManageEngine Applications Manager is built for installation on Windows Server or Linux. It is available in three editions: Free, Professional, and Enterprise. The Free version is limited to five monitors. The Professional edition covers a single site and the Enterprise edition will monitor multiple sites. Applications Manager is available for a 30-day free trial.
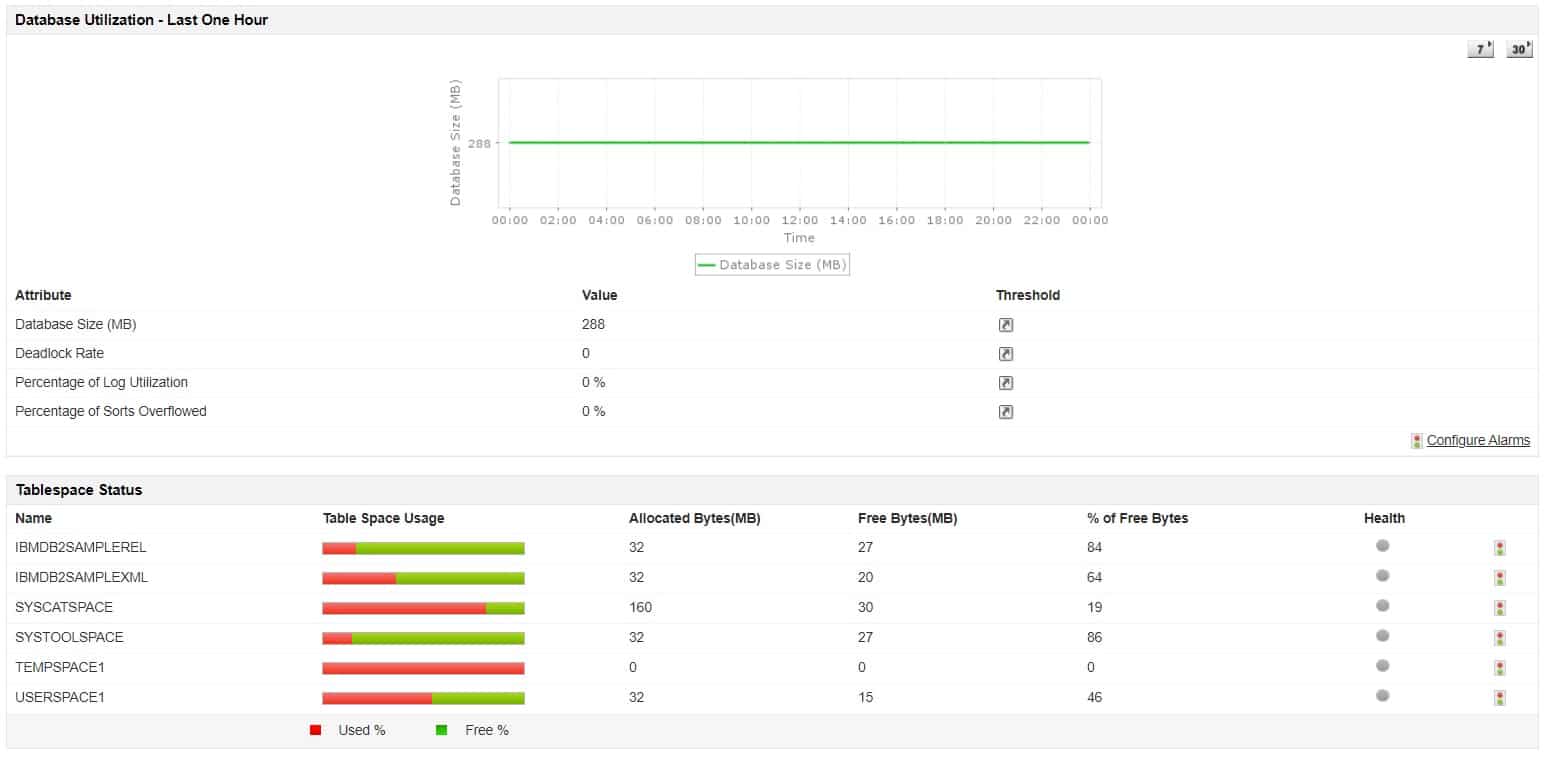
6. Opsview
Opsview is a monitoring service for networks, servers, and applications. Much of the full capability of Opsview is not immediately available. These services are available in a library of add-ons, which are called “opspacks.” There are opspacks available to monitor Db2. It is also possible to install Nagios plugins in Opsview.
The Db2 monitor in Opsview doesn’t include many metrics for DB2 instances. All it will provide is an availability check. However, this service will reach out to all DB2 instances no matter whether they are local, on remote sites, or on the cloud. Fortunately, the ability to install Nagios plugins in Opsview saves this monitoring system from being completely dismissed by Db2 users.
Opsview is able to monitor a long list of database management systems, not just DB2. This means that you can centralize all of your database monitoring in one console. The Opsview system automatically discovers all operating applications and detects connections between them. So, the Opsview system can compile an application dependency map, which helps with root cause analysis when problems arise in the system.
As with most automated monitoring systems, Opsview employs performance thresholds to enable normal operations to be supervised by the tool without human intervention. The thresholds set ranges of acceptable performance. These settings relate to the availability of supporting resources as well as database issues such as availability and response times. If performance drops or if resources run low, the thresholds trigger alerts. Those alerts can be forwarded as notifications by email, SMS, or Slack message.
Opsview is available for installation on your own host. The software installs on Linux. There are two on-premises versions. One is called SMB. This caters to less than 200 hosts. The larger plan is called Enterprise and this will monitor more than 200 servers. This plan also includes AI processes for services such as threshold setting and root cause analysis. There is also a SaaS version, called Opsview Cloud. This version is available for a free trial.
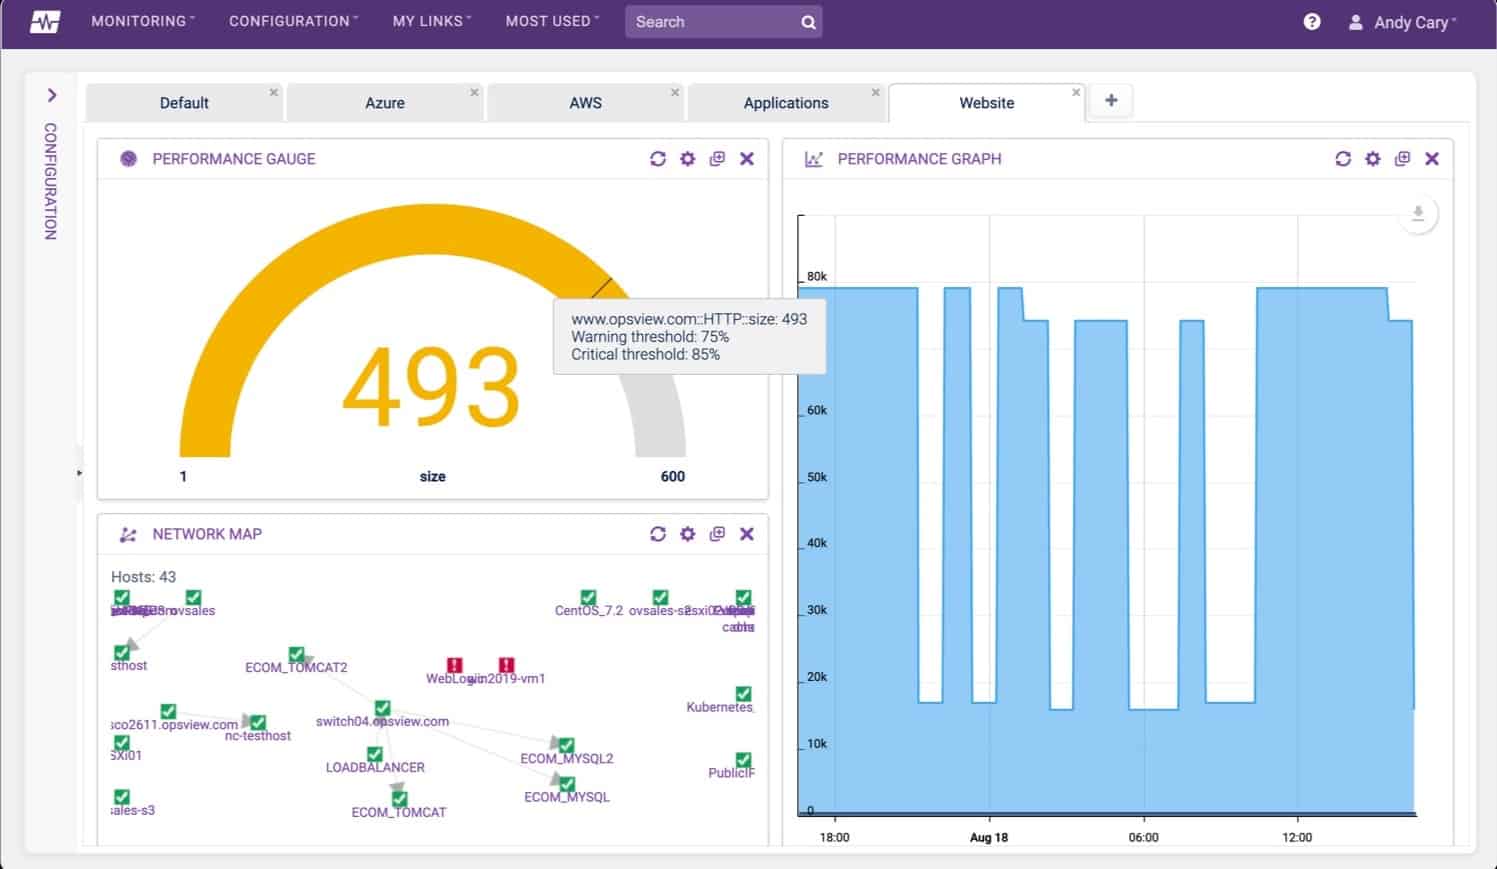
7. AppDynamics
AppDynamics is a division of Cisco Systems. The company offers a SaaS platform for system monitoring. The services of the platform are offered in a menu of specialized monitoring packages. These are Infrastructure Monitoring, Application Performance Monitoring, Database Monitoring, Business Performance Monitoring, and End User Monitoring. It is possible to subscribe to all of these modules in one package, which is called the Enterprise edition. There is also a bundle called the Premium edition, which includes Infrastructure, Application, and Database Monitoring.
One of the database management systems that the Database Monitoring module can supervise is DB2. The system can consolidate the monitoring of database instances running in different locations. It is able to centralize the monitoring of DB2 instances running on Linux, Unix, and Windows.
The DB2 monitor identifies each DB2 instance and assesses its size and structure. It will then watch over transaction activity, memory usage, cache hit rates, access types, and application interactions.
If you also run the Infrastructure Monitoring and Application Performance Monitoring modules, you will benefit from an application dependency map that includes DB2 instances. This service supports root cause analysis.
AppDynamics uses AI processes, which are collectively called Cognition Engine. The Cognition Engine manages performance expectation threshold levels and identifies anomalies. These thresholds raise alerts if performance drops or resources approach exhaustion.
AppDynamics is a subscription service with a rate per month for each edition. The service is available for a 15-day free trial.
L’article 7 Best IBM Db2 Monitoring Tools est apparu en premier sur Comparitech.


0 Commentaires