
Redis stands for Remote Dictionary Server and is a fast-growing NoSQL database system that stores all of its data in the server’s memory. The system does maintain a data file, but this is entirely loaded into memory on startup. The system will also write out to the file from time to time during normal operations.
So, there are two critical server resources that you already know need to be tracked closely in order to ensure that Redis keeps running smoothly: memory and disk space. Another tricky feature is that it runs a process that operates as a server and then forks a new process to deal with each request. That system slots processor capacity up in the list above disk space to become the second most important server resource to monitor for Redis.
Here is our list of the five best Redis monitoring tools:
- AppOptics EDITOR’S CHOICE This monitoring system offers a great combination of detailed server status monitoring plus a specialist integration for Redis. Track all connected applications with this cloud-based service. Get a 30-day free trial.
- SolarWinds Database Performance Monitor (FREE TRIAL) A focused cloud-based system for monitoring a range of database management systems, including Redis.
- Site24x7 Infrastructure A flexible cloud-based monitoring package that will give you views on server resource usage and Redis monitoring from a special integration.
- Datadog A cloud-based monitoring platform that includes an extension for monitoring Redis databases.
- ManageEngine Applications Manager An on-premises package that examines the Redis database, its host, and the applications that connect to it. It is available for Windows Server and Linux.
Although the database handles process termination well, there is always a risk with subordinate processes that some are going to be left abandoned but still officially available. This clogs up your processor with unwanted processes – a factor that needs to be identified and dealt with.
All of the major cloud platforms offer Redis hosting services, so there is the possibility that you need to manage a cloud-based Redis implementation. Even if you don’t have a cloud Redis implementation right now, there is no reason to rule that option out when choosing a monitoring system for Redis.
Requirements for a Redis monitoring tool
We have already identified some fundamental requirements for a Redis monitoring tool
- Memory monitoring
- Process monitoring
- Disk monitoring
- On-premises and cloud monitoring capabilities
As it is very possible that you might end up managing Redis instances both on your server and on a cloud platform, it would be nice to have a Redis monitoring tool that can supervise both of these environments and unify monitoring in one screen to reduce the need for switching between live monitoring dashboard pages.
Another great enhancement to aid your Redis management strategy would be a monitor that could identify those services and applications that use Redis databases and watch their interactions. By this method, together with server resource monitoring, you get monitoring services above and below your Redis implementations.
Add a requirement for a monitoring tool that can look inside the system and identify the efficiency of operations, and you will have a complete Redis monitoring tool.
Efficient Redis monitoring
There are a number of ways that the wrong monitoring tool can cost you time, effort, and money. The biggest is if it is only able to perform monitoring for Redis. Although Redis is becoming increasingly important, it is never going to become the pivotal application for your organization. You have plenty of other applications to worry about – including other database management systems.
You don’t want to get a standalone Redis monitoring system because then you will have to waste time switching to a different console every time you want to check everything is OK. If you end up with a Redis monitor that charges per seat, then you will probably only authorize one user account to access the console. That makes tracking access to the account harder and will end up reducing the strength of your security monitoring strategy by making it impossible to identify which technician was on the Redis monitor and when.
This means that your best option for a Redis monitor is one that is integrated into other monitoring services and gives you a range of functions, allowing you to supervise many different resources and applications from one location.
A Redis monitor that has an integrated alerting system would be a great time saver. Systems that institute performance thresholds really reduce your operating expenses. These tools watch over the Redis database unsupervised. Such a monitor usually also issues an alert if performance fails a test. It should be possible to set up the system so that it forwards those alerts to a member of staff by email or SMS.
Alerting systems effectively automate your Redis monitoring tasks because you can put staff onto other tasks, knowing that someone will be called back to the monitor’s dashboard if a problem is detected. It is smart to set those alert thresholds low enough so that they buy you time to fix problems but high enough so that you aren’t pestered by notifications all the time. Some monitoring services even work out the ideal level for performance thresholds through AI-based machine learning – that’s a great time saver.
The Best Redis Monitoring Tools
There are many Redis monitoring tools available at the moment and investigating all of them will take up a lot of your time. Fortunately, this guide will cut down your candidate selection time by narrowing down your search to those monitoring tools that we have identified as the best.
You can read more about each of these options in the following sections.
1. AppOptics (FREE TRIAL)
AppOptics is a cloud-based service that is able to monitor Redis implementations on your premises and also on cloud platforms. AppOptics can be extended by a library of free integrations. There is an integration available for Redis monitoring.
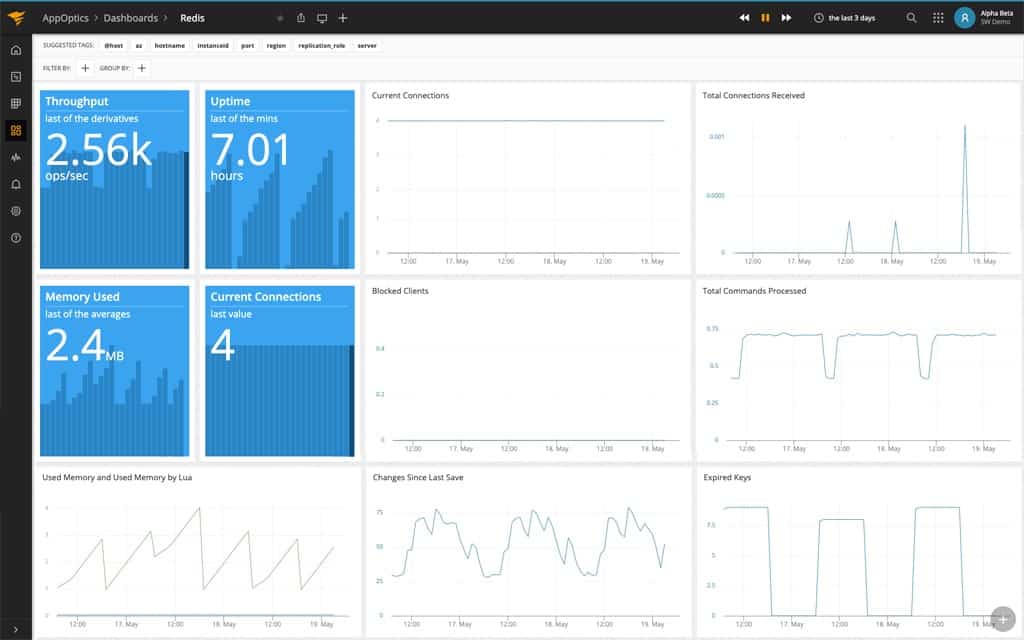
The dashboard for AppOptics shows all of the key metrics you need for Redis monitoring all on one page. The system metrics are mostly shown as time-series graphs. The most recent reports on four key statistics are shown at the top left of the screen and they really stand out. These are:
- Throughput in KB per second
- Uptime in hours
- The latest average memory usage
- Current connections count
The graphs shown in the screen convey the following statistics over time:
- Current connections
- Total connections received
- Blocked clients
- Total commands processed
- Used memory
- Changes since last save
- Expired keys
Any of those graphs can be expanded. It is also possible to create your own custom screens by selecting elements to group together.
What makes AppOptics a particularly powerful monitoring system for Redis is that it also has a comprehensive battery of server resource monitoring modules. These include the tracking of those important server resources that keep Redis running, such as CPU utilization, memory usage and availability, disk operations, and disk capacity.
This Redis monitoring tool isn’t limited to monitoring on-premises implementations. It can also monitor AWS Elasticache and also Azure services. In all locations, monitoring services include performance thresholds and alerts. The system presents an infrastructure overview that highlights potential problems. Drill down on that highlighted area to get greater detail of exactly which element is in difficulty.
The AppOptics system is available in two editions. The Infrastructure Monitoring tool includes all of the utilities you need to monitor Redis and your server resources and also cloud platforms. The second plan is Infrastructure and Application Monitoring. As the name implies, this adds on application performance tracking, which lets you see which applications interact with your Redis instances.
AppOptics is a subscription service and you can get it on a 30-day free trial.
EDITOR'S CHOICE
AppOptics is our top pick for a Redis monitoring tool because it provides all of the live metric tracking you need for Redis activity as well as live server monitoring. This combination gets even more interesting thanks to the ability to customize dashboard screens and group both server and Redis statistics together in one place. Alerts let you leave AppOptics to watch your Redis instances while you get on with other tasks.
Get 30-day Free Trial: my.appoptics.com/sign_up
OS: Cloud-based
2. SolarWinds Database Performance Monitor (FREE TRIAL)
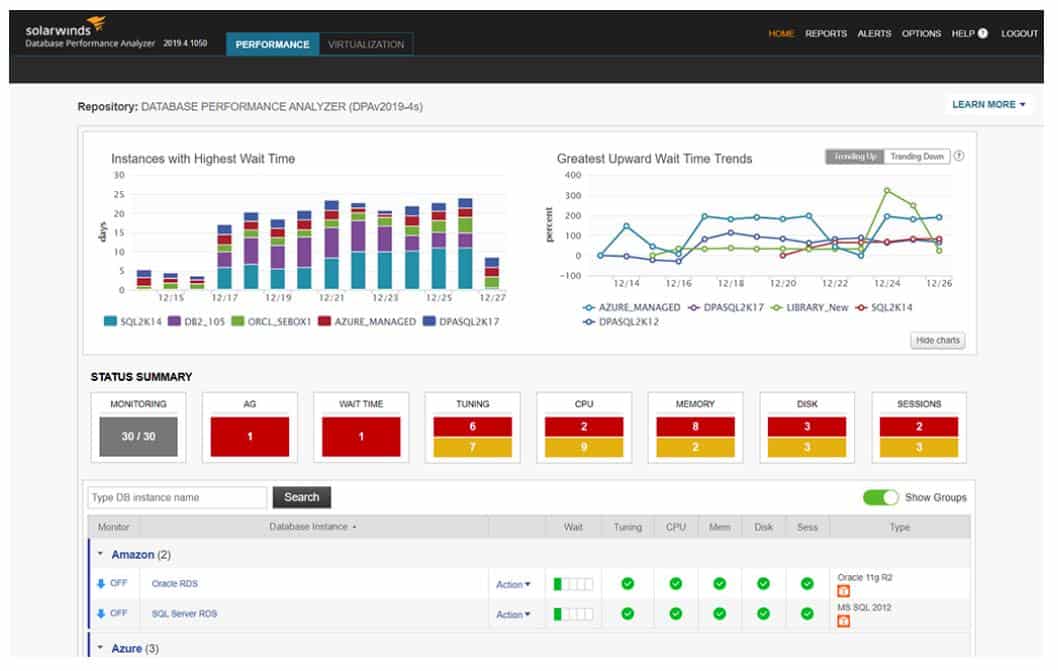
SolarWinds Database Performance Monitor is a SaaS system that can supervise Redis instances as well as other database management systems. This system isn’t limited to monitoring instances on your in-house servers, it can also monitor instances on cloud platforms.
This tool includes remarkable data visualizations for all of the performance statistics that it gathers. The system is adaptable. You add on a plugin from a library to give the system the capabilities of monitoring a specific type of database. There is a plugin for Redis, so your first task on opening an account with the SolarWinds Database Performance Monitor is to activate the Redis plugin.
The statistics that the monitor will collect and display include factors related to memory, CPU activity, disk usage, performance, and persistence. Within the database, it is able to analyze the most frequently executed data fetches and how they perform. It can show the most memory-intensive queries to aid performance tuning.
As the SolarWinds processing system is located in the cloud, data needs to be collected by an agent on the host of your Redis database. Collected data is then transferred to the SolarWinds server over an encrypted connection. Data stored on the SolarWinds is also encrypted.
It has the availability to monitor MySQL Azure SQL Server, MongoDB, PostgreSQL, and Amazon Aurora. This is a subscription service and it is available in two plans: Standard and Premium. The difference between these two plans is that the Premium plan has a longer retention period and includes more finely-tuned access accounts to the monitoring system. You can get SolarWinds Database Performance Monitor on a 14-day free trial.
3. Site24x7 Infrastructure
Site24x7 is a cloud-based monitoring platform that offers network, server, application, and website monitoring in a range of packages. The Site24x7 Infrastructure plan monitors networks, servers, and services and it can be expanded by a special plugin to monitor Redis.
The standard bundle for Site24x7 Infrastructure includes a credit to monitor up to ten servers. As it is based in the cloud, there is no specification on where those servers should be. The allowance of one plugin on the plan is per server. You don’t necessarily have to use the same plugin for each server. So, if you have Redis running on one of your Linux servers on your site you can just use the plugin allowance for that server for Redis monitoring.
Site24x7 Infrastructure is able to monitor cloud platforms, including AWS and Azure. There is a plugin to monitor AWS Elasticache, which is the Amazon implementation of Redis. There is also a plugin for Azure Redis Cache.
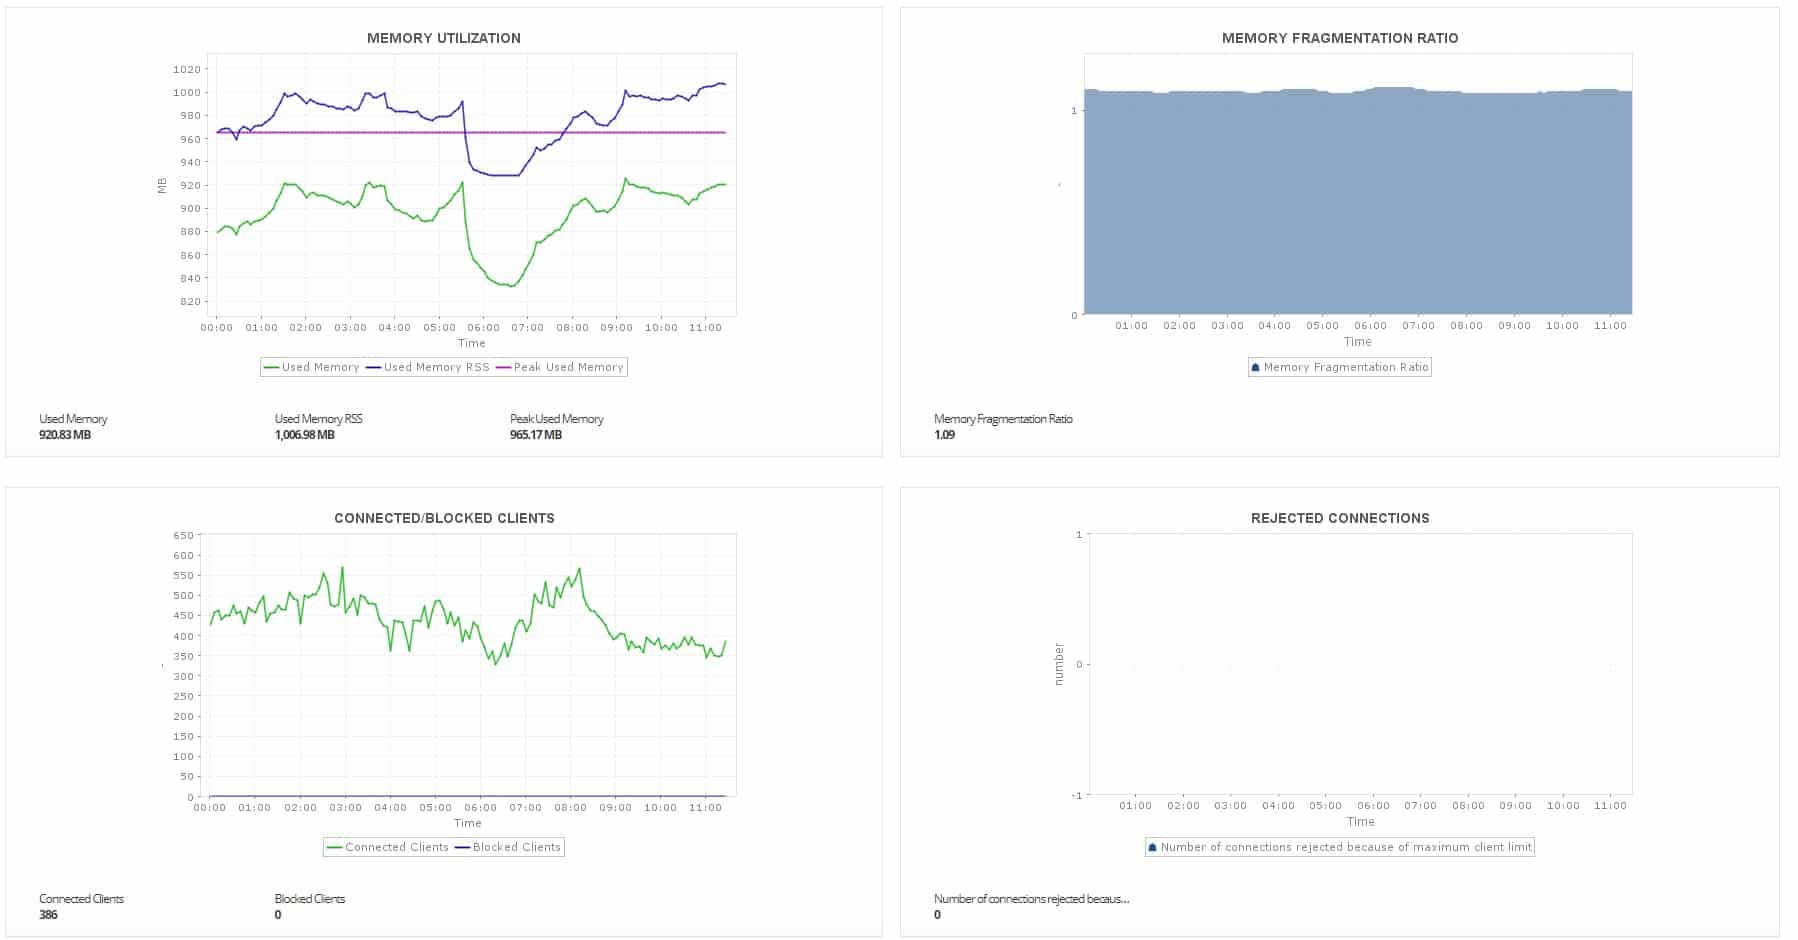
The standard server monitoring feature in Site24x7 gives you the ability to monitor CPU, memory, and disk activity on your Redis host. The Redis monitor delivers the following live statistics:
- Used memory
- Peak used memory
- Used system CPU
- Used user CPU
- Used user children CPU
- Keyspace hits
- Keyspace misses
- Total connections
- Rejected connections
- Connected clients
- Connected slaves
The Site24x7 system places performance thresholds on all measured statistics and the alerts that these triggers create can be forwarded as notifications by email or SMS. Site24x7 Infrastructure is available on a 30-day free trial.
4. Datadog Infrastructure
Datadog Infrastructure is one of the plans offered by the Datadog monitoring platform. This system is delivered from the cloud. The plan is intended to supervise all of the services that support user-facing software, whether they are office software systems delivered over the network or Web services and websites made available over the internet.
The most important feature of Datadog Infrastructure is its library of integrations. If Datadog loaded all of its capabilities into the Infrastructure package out-of-the-box, the dashboard would be immense. There are more than 400 integrations available.
By activating the Redis integration, you will add extra screens to the dashboard and the system sends out probes to the hosts of your Redis instances. As well as a Redis plugin, you will find an integration for AWS ElastiCache and Azure Redis Cache. So, you can monitor Redis databases on the cloud as well.
Datadog is able to collect a large number of different statistics that illuminate database performance. These include four memory-related metrics, four activity statistics, two persistence indicators, and three error-related statistics. You can decide which of these factors are displayed in the dashboard – you don’t have to watch all of them.
You can customize the screens in the Datadog dashboard, which will also examine the interaction between the Redis database and server resources. It will track host resource availability for all of the processes on the same server, so you can see whether resources are running out and which applications to kill or move in order to make space.
You will get an alert when performance drops or resources reach a point of exhaustion. The highest plan of Datadog Infrastructure includes machine learning processes to automatically adjust performance thresholds to reduce false alarms. Alerts can be forwarded to members of staff by email or SMS. The higher plan, which is called Enterprise, also includes an automatically created application dependency map. That speeds up root cause analysis when problems arise.
The base plan of Datadog Infrastructure is called Pro and there is also a Free edition, which is limited to monitoring one host. You can get a 14-day free trial of the Pro and Enterprise editions.
5. ManageEngine Applications Manager
ManageEngine Applications Manager gives you a very wide view of how your Redis databases fit into your entire system. The service tracks all applications and all server resources and it creates a map that shows how everything fits together. The automatic application dependency map is constantly updated and it shows all of the systems that access your Redis databases and all of the resources that the database relies on.
The Applications Manager tracks a range of memory statuses as part of its Redis monitoring service. It looks at specific Redis-driven memory events as well as system-wide memory statuses. The monitor also looks at network interactions by the Redis database. This is a very relevant factor with Redis because it is a clear indicator of successful interaction with client applications.
Dataset persistence is a matter of interacting with the storage file that backs up the database and reloads it into memory after a system crash. Applications Manager checks on persistence factors and also checks on the health of the storage file.
Applications Manager, with its performance thresholds and alerts, is a very suitable complete system monitor for teams that are stretched and expected to multi-task. Alerts can be sent out as notifications by email or SMS. The prepared application dependency map is there to speed up root cause analysis.
The software for Applications Manager installs on Windows Server or Linux. It is available in three editions: Free, Professional, and Enterprise. The Free edition will only run five monitors. The Professional version can monitor one site and the Enterprise edition is designed for large, multi-site businesses. You can try Applications Manager on a 30-day free trial.
L’article 5 Best Redis Monitoring Tools est apparu en premier sur Comparitech.


0 Commentaires