Google Cloud Platform (GCP) is the third-largest Platform-as-a-Service (PaaS) provider in the world. If you subscribe to services, you are not alone because the system has a 7 percent market share in the cloud computing services market.
Many people are customers of Google Cloud Platform without realizing it because the processing packages and storage space service of Google often provide the infrastructure for other services. Among those customers are some of Google’s own products, such as Google G-Suite or Google Workspace.
Modern businesses blend together services from different providers, so you might have accounts with AWS and Azure as well as services from GCP. It is not uncommon to end up with hybrid systems that combine on-premises software with Cloud computing services. So, you need to be able to monitor all of these systems in one package rather than being forced to open up several different monitoring systems in order to look at your home infrastructure, your remote sites, and your cloud services.
Here is our list of the seven best GCP monitoring tools.
- AppOptics EDITOR’S CHOICE This cloud-based service is able to monitor applications, services, and virtual infrastructure on GCP, other cloud systems, and on your premises. Start a 30-day free trial.
- Site24x7 Infrastructure A comprehensive monitoring tool for all GCP services that can simultaneously monitor services of other cloud platforms plus on-site systems. This is a cloud-based service.
- Datadog Infrastructure A cloud-based package of monitoring tools for applications, virtual environments, services, and server resources that includes a plug-in for GCP monitoring.
- Paessler PRTG A collection of network, server, and application monitors that includes cloud service monitoring. Available for installation on Windows Server or as a cloud-based service.
- ManageEngine Applications Manager An on-premises software package that monitors applications, virtualizations, services, and servers on-site or on the cloud. Available for Windows Server and Linux.
- Dynatrace A cloud-based monitoring system for applications and services that includes AI technology to track the performance of cloud services including GCP.
- Opsview A monitoring system for servers and applications. This tool is able to monitor all resources whether they are on-premises or in the cloud and it has a special extension for the Google Cloud Platform. It installs on Linux or is available as a cloud-based service.
The Best Google Cloud Platform monitoring tools
It is very, very rare for a business to only have GCP infrastructure and no other IT resources. Unless you are one of those few all-GCP businesses, you have a lot of other technology that you need to monitor.
We didn’t focus on tools that only monitor GCP for this review. Having to use several different monitoring systems to cover all of your IT systems is a waste of time and money. Modern systems are interconnected and the applications that you use on Google or the Compute Engine cloud storage accounts will feed through to other services on the cloud and on your site. You need to be able to trace through all the connected hardware and software that your business uses so that you can get an overview of all of your resources connected together.
In the search for useful monitoring tools, we looked at systems that had excellence in GCP monitoring as part of a wider IT resource monitoring service.
1. AppOptics (FREE TRIAL)
AppOptics is an infrastructure and applications monitoring system that is based in the cloud. As it doesn’t need to be hosted on your premises, it is not limited to monitoring your on-site systems. Its cloud monitoring capabilities extend to identifying services that interact with your on-site resources.
As well as monitoring cloud platforms, this service can monitor cloud-based services, such as G-Suite. The dashboard for the service is cloud-resident and it can be accessed from anywhere through any standard browser. The system shows live time-series graphs of performance for each component of your infrastructure.
You will be able to set performance thresholds and, should service levels drop below acceptable performance, the system will trigger an alert. Those alerts can be sent out as notifications by email, SMS, and Slack notification. The alert system also applies to infrastructure capacity issues, such as CPU availability, memory, and disk space.
The AppOptics system has two modules – Infrastructure and Application monitoring. Subscribers to the application monitoring service also get the infrastructure monitoring facilities as well. The application monitor creates an application service map that assists in root cause analysis when problems arise in a user-facing piece of software. The true cause of the problem needs to be identified quickly and this plan helps with that.
Other features in the tool include live code profiling that can identify exactly which line of which program is causing problems. It can also track the influence of frameworks and platforms, such as .NET.
AppOptics is a subscription service and you can experience it on a 30-day free trial.
EDITOR'S CHOICE
AppOptics is our top pick for Google cloud monitoring because it can cover other cloud platforms as well and blend GCP services monitoring with the applications of other providers. While covering all cloud services, this system can also include your on-premises virtualizations, services, and applications, creating a full overview of all your IT resources no matter where they are based. As this is a cloud-based service, you can access it from anywhere through a web browser.
Get 30-day Free Trial: my.appoptics.com/sign_up
OS: Windows Server
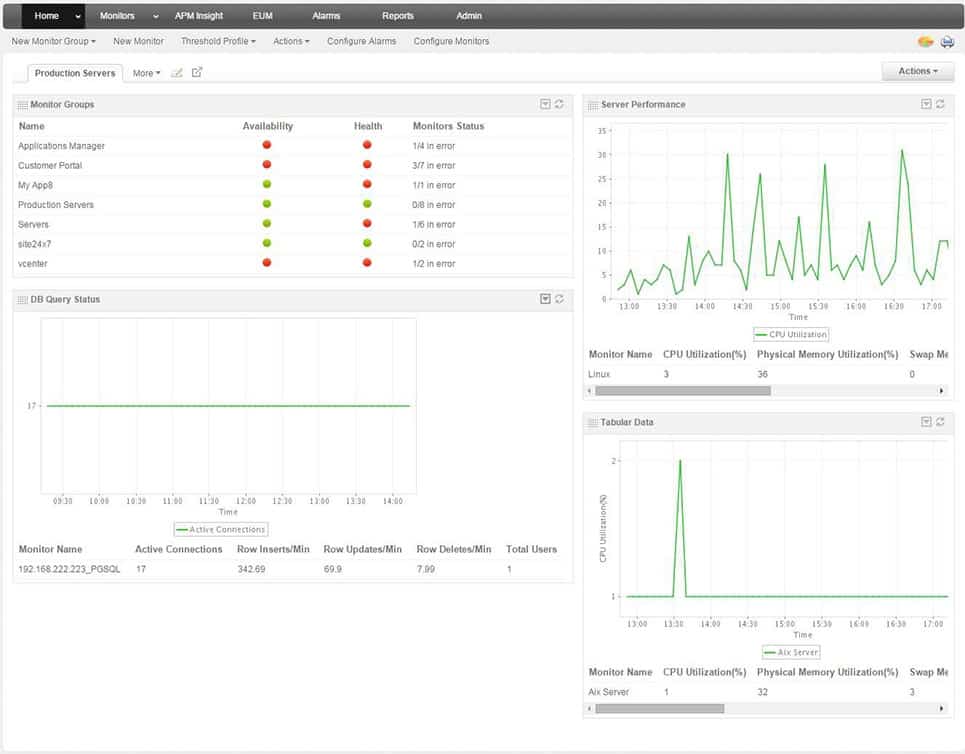
2. Site24x7 Infrastructure
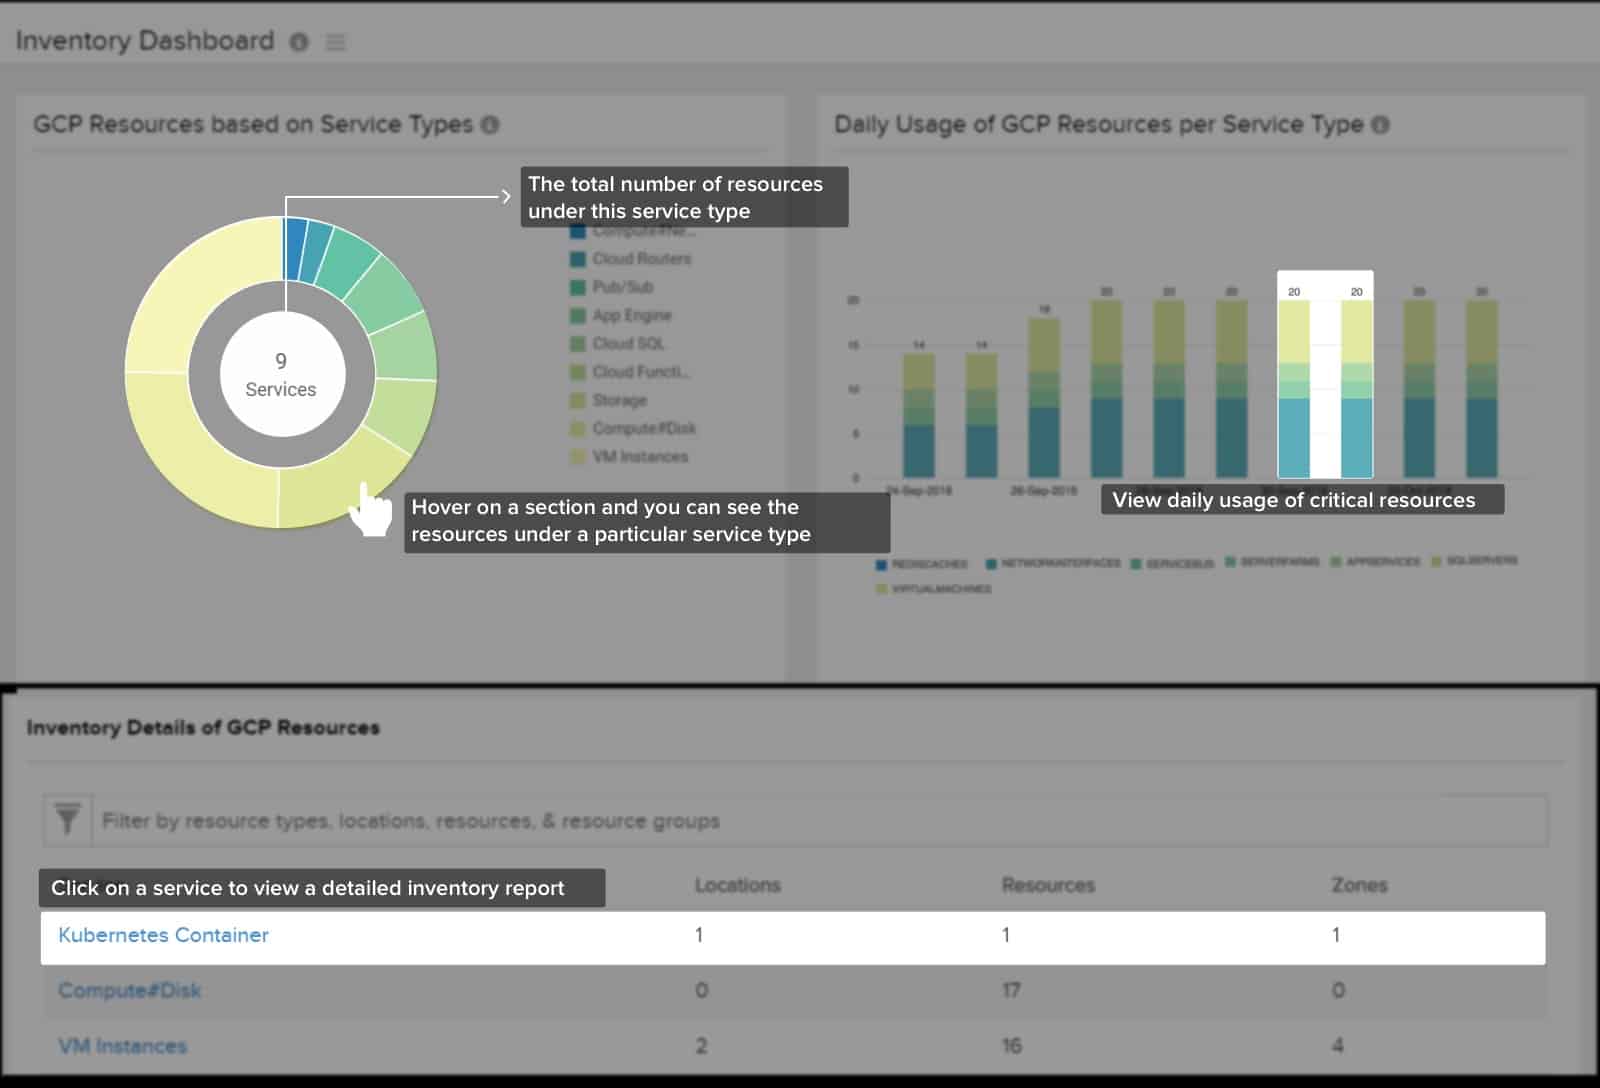
Site24x7 Infrastructure specializes in monitoring cloud infrastructure and services but it can also track the performance of on-premises applications and their hosts. This tool is able to thread together the connections between all of your infrastructure, so you will see how your GCP services interact with other resources.
The system includes an autodiscovery feature and that is able to detect Google Compute Engine (GCE), Google App Engine (GAE), Google Kubernetes Engine, VPC, Cloud IAM, Cloud Audit Logging, Cloud SQL, and BigQuery instances, among others. The system can also track AWS and Azure services.
The Site24x7 Infrastructure service includes AI-based processes to identify the root cause of problems and also to fine-tune performance thresholds. Those thresholds trigger alerts that can be forwarded as notifications by email and SMS. The system also includes an automated remediation service that can kick in with processes that you specify should performance issues occur.
The Site24x7 Infrastructure system is based in the cloud and you access the dashboard through any standard browser. The screens in the console are customizable, which means that you can gather together data in one place, deciding whether data should be shown as lists of statistics or as graphs.
The Infrastructure plan is very flexible. As well as monitoring applications and services, it is able to give you server and network monitoring. An account gets you credits for a number of monitoring functions and you decide where to apply them. You can also add on extra monitoring credits for a fee.
The inclusion of physical asset monitoring means that you can view your entire IT system within the Site24x7 monitor from cloud applications all the way through your network to its performance on endpoints in your offices.
The Infrastructure plan is changed for on a subscription and you can experience it on a 30-day free trial.
3. Datadog Infrastructure
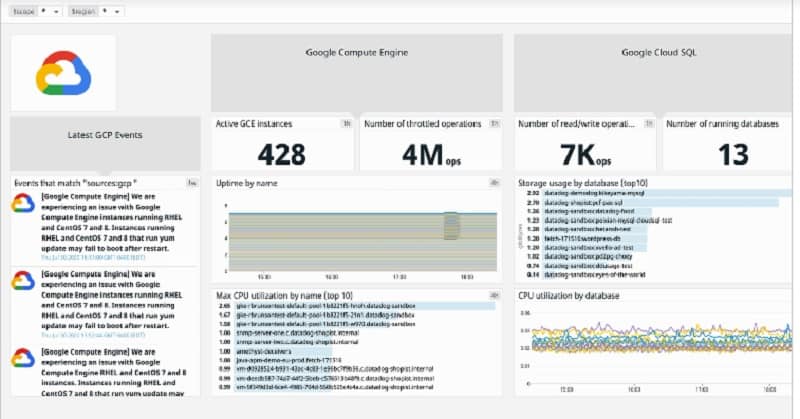
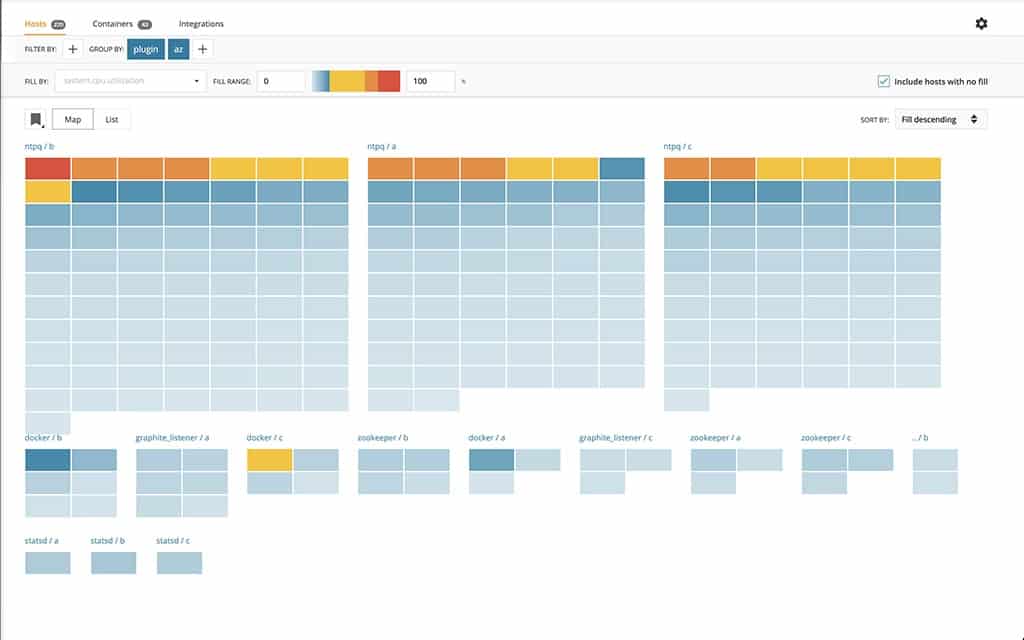
Datadog Infrastructure is able to monitor cloud-based resources and also on-premises infrastructure. It examines the exchanges between those applications and services that support your user-facing software back down to the hosting server. The system is based in the cloud, so it isn’t restricted to monitoring services on one site. It is able to monitor cloud-based servers and services just as easily.
The Datadog system is marketed as a standard package but it also has a library of integrations. These are free extensions to the system that add on extra sensors and also new screens in the system dashboard. There is an integration for Google Cloud Platform, so you can be sure that this monitoring system is very well set up to help you manage your GCP services.
As well as showing performance data live, the Datadog system collects metrics and stores them for capacity planning and other historical analysis tasks. The dashboard supports forecasting for planning and the system is also useful for parallel execution for comparison between systems when planning system migrations to the cloud. This ability applies to all of the services that the system monitors.
The Datadog Infrastructure service is charged for by subscription and there are three editions: Free, Pro, and Enterprise. The Free plan is limited to monitoring five hosts and it has a one-day data retention period. The Pro edition includes most of the monitoring services that you will need for GCP but advanced, AI-based features are reserved for the Enterprise edition. You can get a 14-day free trial of either of the paid plans.
4. Paessler PRTG
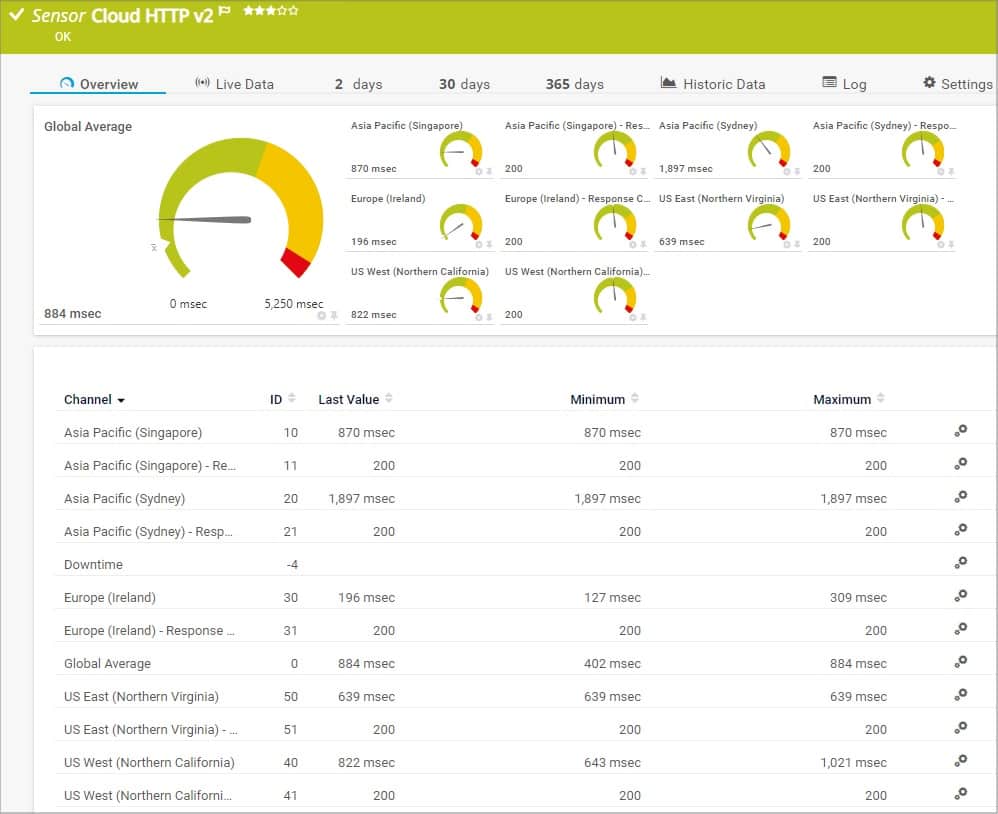
Paessler PRTG is a collection of monitors that cover networks, servers, and applications. It is on-premises software, but it is not limited to just monitoring the site on which it is installed. It is also capable of monitoring remote sites and cloud services, such as those supplied by Google Cloud Platform.
The PRTG system is able to check on the connections to GCP servers and make sure that all of your services are available. When you exploit your GCP services in conjunction with other applications, whether from other cloud services or site-based systems, you can see how they flow together and observe their dependencies.
PRTG has performance thresholds that trip in service quality drops or device capacity gets used up. These trigger alerts, which should buy you time to fix problems and head off potential disaster. The alerts can be sent out as email or SMS notifications.
The PRTG dashboard presents performance metrics as lists of information and also as graphs and charts. The system is customizable because Paessler charges for PRTG in blocks of sensors. The delivered software package includes all capabilities and you decide which sensors to turn on until you have used up the allowance that you bought.
PRTG is available for installation on Windows Server and there is also a version available as a cloud-hosted service. You can get the on-premises version on a 30-day free trial that includes all sensors activated.
5. ManageEngine Applications Manager
ManageEngine Applications Manager monitors applications and servers and is able to supervise cloud resources as well as on-premises systems. The Applications Manager will monitor CPU statistics on your Google Compute Engine account and it also has storage monitoring capability if you subscribe to storage space from GCP.
The service is also able to track virtualization performance and identify the relationships between virtual servers and virtual machines. The ManageEngine system will watch over how your GCP services connect to your on-premises applications and create an application dependency map to facilitate root cause analysis if things go wrong.
Applications Manager has an AI system for adjusting performance thresholds. This prevents the system from triggering alerts unnecessarily. Those alerts can be forwarded to you by email, SMS, or Slack notification.
Applications Manager is an on-premises software package that is available for Windows Server and Linux. There are three editions of Applications Manager: Free, Professional, and Enterprise. The Free version only includes five monitors. The Professional edition is for a single site and the Enterprise edition is suitable for large businesses that require a large volume of monitoring activity. You can test Applications Manager on a 30-day free trial.
6. Dynatrace
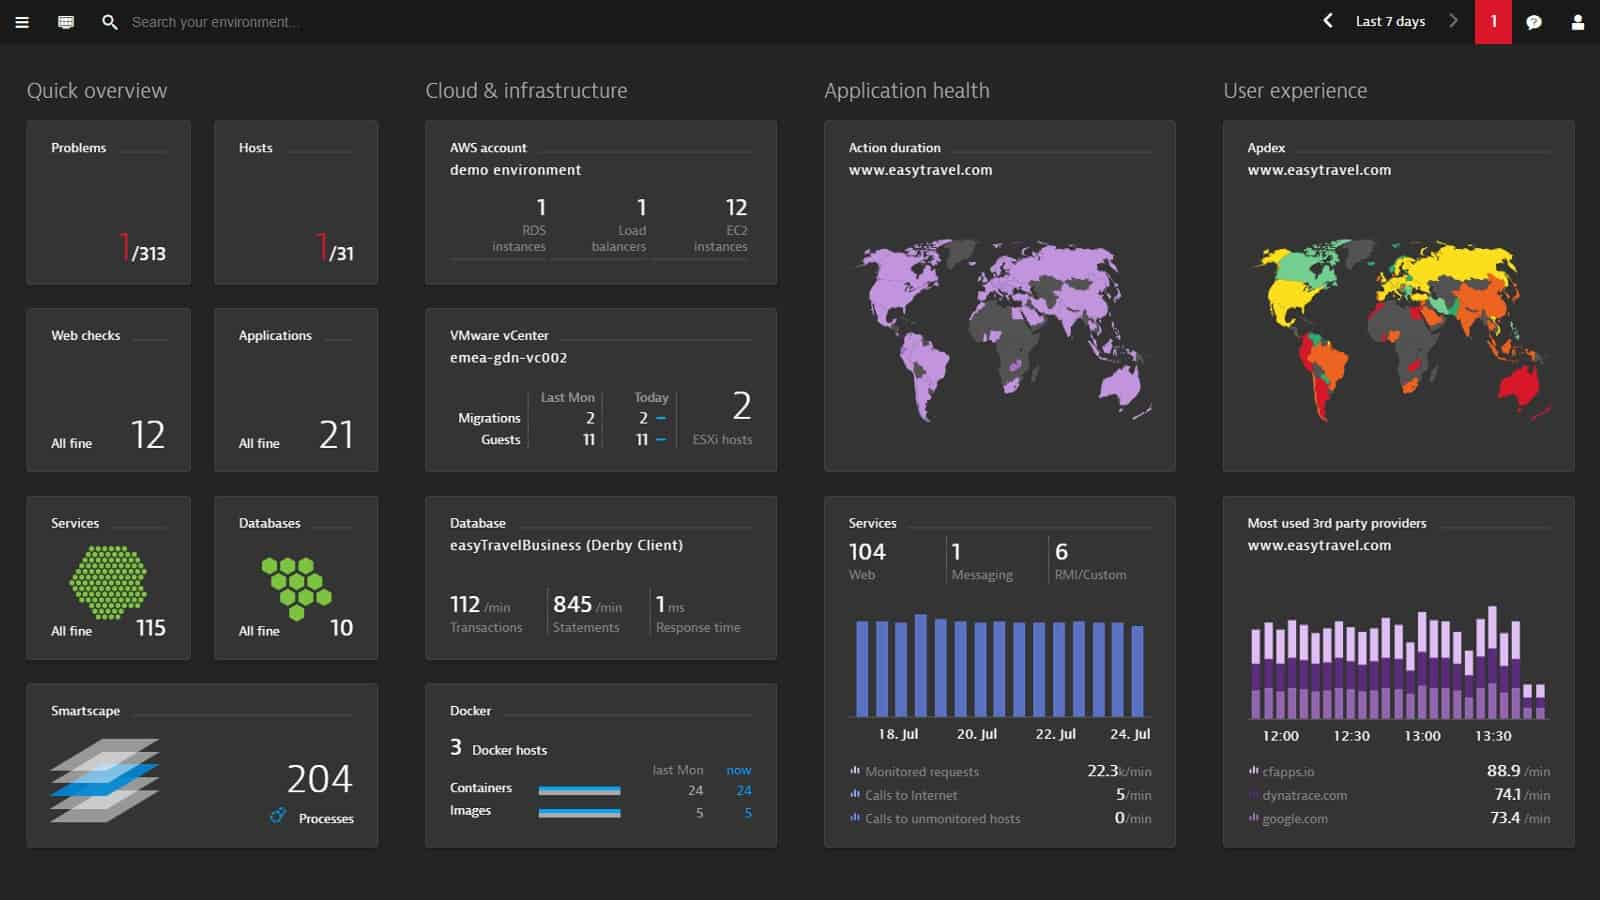
Dynatrace is a monitoring system for applications and services that are located on-site or in the cloud and it particularly excels at monitoring Google Cloud Platform. The company is a Google Partner and has been able to produce a system that is fully integrated into GCP.
This innovative monitoring service is itself delivered from the Cloud. Dynatrace is able to collect operating statistics from the platform and it also gathers user experience statistics, which can be another source of indications of system problems.
The Dynatrace system includes a lot of AI-driven automation. That includes the setup phase for the software. It scans your GCP accounts and registers all of the facilities that you subscribe to. It then assembles application dependency maps and identifies other internal structures, such as virtualization operations.
The application dependency maps put all research in place so that, if a performance issue arises somewhere in the system, the root cause analysis module of the monitor can quickly identify where problems are based.
Dynatrace also uses AI for performance baselining. This establishes a normal level of operation and is a standard against which the system can judge problems. Any deviation from standard performance raises an alert and triggers system investigation. The Dynatrace system automates as much of the monitoring tasks as possible.
The overview that Dynatrace gives of your system stretches out beyond Google Cloud Platform as it links up with all of your subscriptions for services like AWS and Azure. It is also able to include any applications and services that you host on your own servers.
Dynatrace is charged for by subscription at a rate per month. The service is offered in a number of plans and to get monitoring for GCP you would need to consider the Full-stack Monitoring and Infrastructure Monitoring packages. You can get a 15-day free trial to assess the system for yourself.
7. Opsview
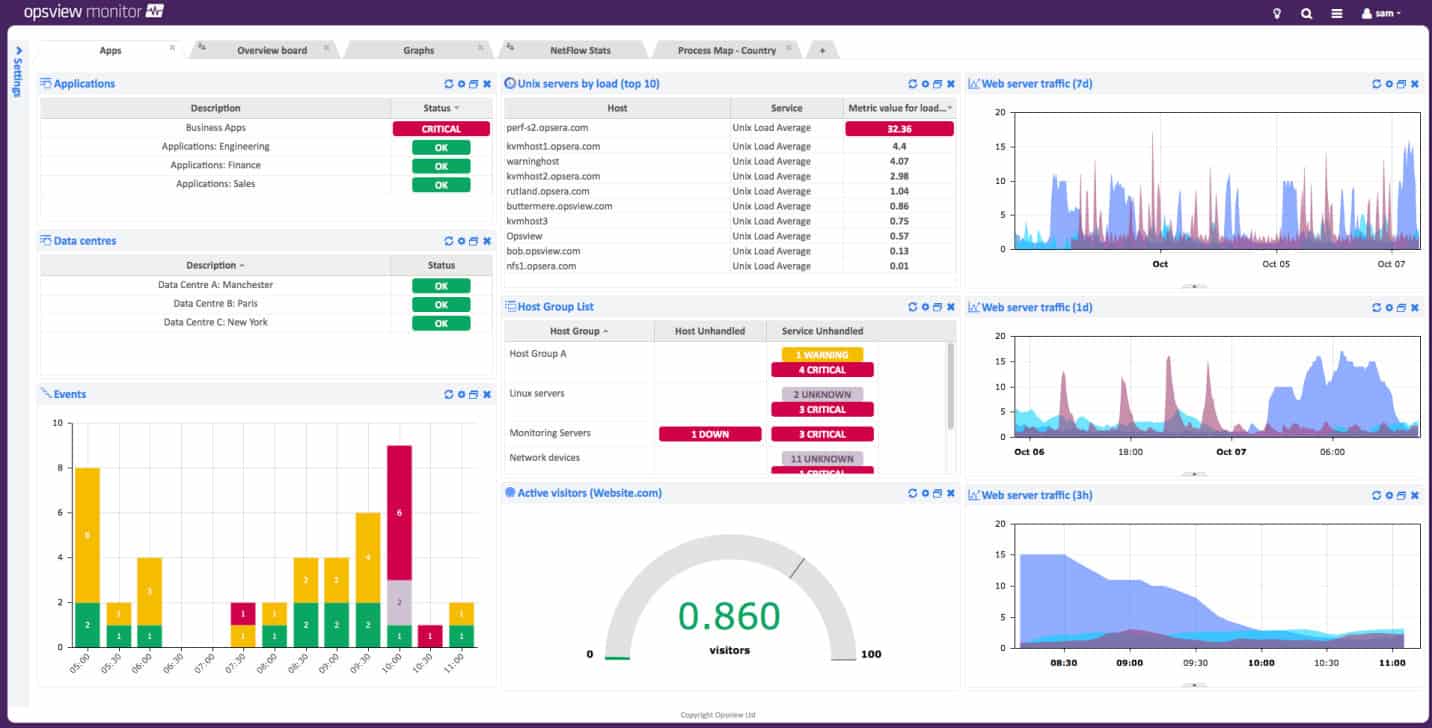
Opsview is able to present a single view of hybrid systems, monitoring resources anywhere, including cloud platforms. The standard monitoring bundle of Opsview can be extended by plug=ins, called opspacks. There is an opspack for GCP. It is free and it adds on extra sensors and new screens to the core Opsview service.
The GCP opspack gives you monitoring capabilities for Compute Engine, Cloud Storage Buckets, and Cloud SQL Database instances. These functions are in addition to all of the other system monitoring features in the standard areas of the Opsview service.
The Opsview service searches through applications like a Web crawler and passes across sites and through different cloud platforms to string together an application dependency map. The system is particularly strong at chaining back from websites through services and APIs to get a full picture of the entire backend that supports those sites.
The system is able to identify virtual systems and map connections there, such as the relationship between virtual servers and virtual machines.
Opsview is offered in three versions. There is the SMB plan for small businesses and the Enterprise plan for large organizations. Both of those versions install on Linux servers. There is also the Opsview Cloud plan, which is hosted. You can get a demo of the cloud service.
L’article 7 Best Google Cloud Platform Monitoring Tools est apparu en premier sur Comparitech.


0 Commentaires