Azure offers virtual server space and so much more. Customers of Azure can select from a growing list of services that are added to the platform in an effort to compete with the Cloud service leader, Amazon Web Services.
Azure offers packages for processing and other server plans for storage. There are also services, such as Azure AD – an Active Directory implementation – that can be used by businesses even if they don’t have an Azure server space account.
Here is our list of the eight best Azure monitoring tools:
- SolarWinds Server & Application Monitor EDITOR’S CHOICE A bundle of monitoring systems that will monitor the performance of servers whether they be on-site or in the cloud and also cover the applications that run on them. It installs on Windows Server.
- AppOptics (FREE TRIAL) A cloud-based monitoring system that covers virtual environments and applications. This service includes specialized modules for monitoring Azure services.
- Site24x7 Infrastructure A cloud-based monitor for resources located on-site and in the cloud that is able to monitor a range of Azure services.
- Datadog Infrastructure A cloud-based monitoring system that can monitor Azure services and other cloud platform resources and also on-premises infrastructure.
- ManageEngine Applications Manager An application performance monitor that cloud-based and on-premises resources including Azure services. It installs on Windows Server and Linux.
- Paessler PRTG Azure monitoring available from this package of monitoring services that can supervise on-premises and cloud-based networks, servers, and applications. It installs on Windows Server.
- Dynatrace A cloud-based infrastructure monitoring system that deploys AI processes to track the performance of Azure services as well as other resources.
- Opsview A monitoring system that covers servers and applications. It includes on-premises resource supervision and cloud services monitoring, such as Azure systems. It installs on Linux or is available as a cloud-based service.
The best Azure monitoring tools
When we decided to look into the best monitoring systems for Azure, we needed to identify systems that are able to track the performance of a wide range of services from servers and virtualizations, through to application and serverless microservices.
Many businesses mix their systems, creating a hybrid combination of on-site and cloud-based components. So, systems that can monitor that blend of locations and formats are particularly interesting to us.
1. SolarWinds Server & Application Monitor (FREE TRIAL)
SolarWinds Server & Application Monitor has all of the capabilities needed to monitor the wide range of services offered by Azure. Not only that but it can also integrate Azure monitoring into the supervision of on-site servers running Windows Server or Linux and the applications that they host.
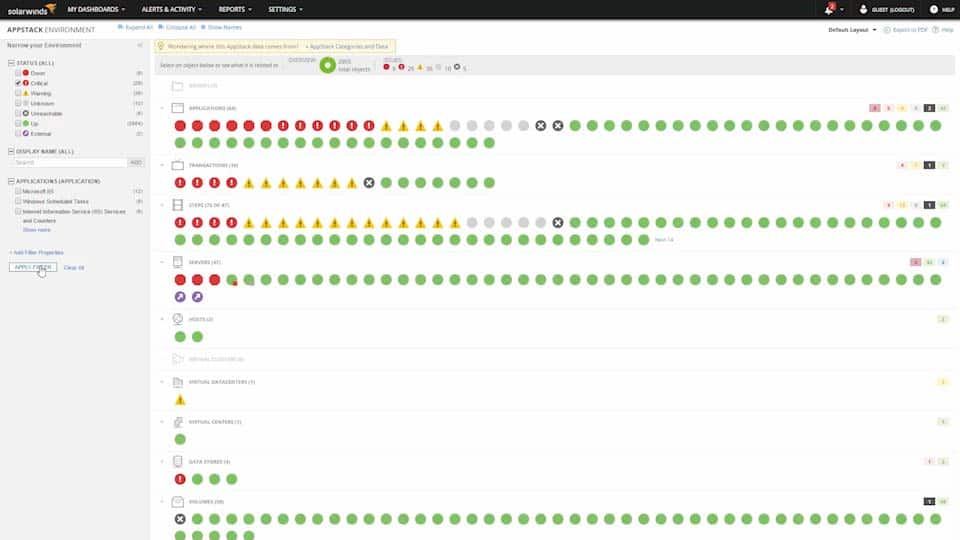
Azure-hosted databases, AD, and other applications plus virtual infrastructure can all be included in this monitoring service. The dashboard of the monitor collects all of the Azure systems on one screen. This leads to detailed information on each service. Relevant metrics, such as response times, capacity, throughput, and connectivity are all tracked. The system places thresholds of acceptable performance on each metric and then constantly adjusts those levels according to patterns of usage.
The SolarWinds system will raise an alert if a threshold is crossed. This shows on the dashboard of the service and can also be forwarded as a notification by email or SMS. This alerting mechanism automates monitoring because you don’t need to put a member of staff watching statuses to spot when things go wrong. This frees up staff for other tasks. A notification will arrive in time to allow you to make system adjustments and prevent problems from becoming critical.
The SolarWinds Server and Applications Monitor is particularly strong at monitoring Microsoft products, including SQL Server, Microsoft 365, and Exchange Server. Features in the monitor include demand trend analysis and application dependency mappings. If you run virtualizations, it can also get inside those and map their structures as well.
The SolarWinds Server & Application Monitor is implemented as on-premises software that installs on Windows Server. You can access it on a 30-day free trial.
EDITOR'S CHOICE
SolarWinds Server & Application Monitor is our top pick for Azure monitoring because it is able to monitor all of the services of the Azure platform as well as servers and applications on-site. This software package runs on Windows Server but it isn’t limited to just monitoring its host. It can also monitor other on-site servers running Linux and Windows servers together with Azure servers.
Get 30-day Free Trial: solarwinds.com/server-application-monitor/registration
OS: Windows Server
2. AppOptics (FREE TRIAL)
AppOptics is a very competent application monitoring system that, like Dynatrace, doesn’t have any network monitoring features. However, for Azure monitoring, that isn’t a problem. AppOptics is able to monitor the full range of Azure services from server space through to serverless systems and applications such as databases.
The Azure monitoring service of AppOptics collects performance metrics in real-time and displays them in the system console in the form of graphs. While watching the performance of applications through issues such as response times, it also monitors the resources of the server that supports your account. So, it will report on factors such as CPU, memory, and disk space utilization.
AppOptics operates a series of performance thresholds on vital indicators and triggers alerts when issues arise. These alerts can be forwarded to you by email, Slack message, or SMS so that you don’t need to watch the monitor’s dashboard all the time.
As well as monitoring systems, AppOptics provides performance analysis services. These include code-level analysis and distributed tracing for the microservices that lie behind APIs. You are not limited to monitoring Azure services with AppOptics. This service is also able to monitor services provided by other cloud platforms and it will simultaneously monitor applications that run on your on-premises servers.
A tracking feature in the application monitoring package of AppOptics is able to build a picture of the interdependencies between applications and services no matter where they are hosted. This is displayed as a stack in the dashboard of the service so you can see which applications rely on which services. This is particularly useful for performing root cause analysis.
AppOptics is a subscription service with annual and monthly payment plans. The system is offered in two editions with the first, called Infrastructure Monitoring including platform monitoring. The second edition includes code profiling, application stack discovery, and distributed tracing as well as the features of the Infrastructure plan. That higher plan is called Infrastructure and Application Monitoring. You can get a 30-day free trial of the full-feature plan.
3. Site24x7 Infrastructure
Site24x7 is a cloud-based system that is able to monitor on-premises and cloud-based resources. Among its capabilities is the ability to monitor virtual systems, such as hypervisors and virtual servers.
The Site24x7 system can be expanded by product-specific integrations. These add extra probes and screens to the monitoring system. Rather than offering a single integration for Azure, Site24x7 offers a list of specialist module monitors for each Azure service.
With the Site24x7 monitoring system fully loaded with its Azure integrations, you can combine these cloud monitors with any other infrastructure of your company based anywhere in the world. Each system requires an agent installed on it.
The dashboard for Site24x7 Infrastructure is delivered from the cloud and it can be accessed from anywhere through any standard Web browser. The screens in the console can all be customized with a drag-and-drop assembly system.
This is a particularly interesting monitoring proposal for businesses that operate a virtual office. It can tie together staff working remotely with Azure services and monitor the whole collection together. Whatever resources you have and wherever they are, Site24x7 Infrastructure creates a map of dependencies between applications, services, and server resources. It can show how your Azure services interact with each other and with your resources based on other platforms. This plan lays down the pathways for root cause analysis when performance drops.
Site24x7 Infrastructure is charged for on a monthly subscription and you can access it on a 30-day free trial.
4. Datadog Infrastructure
The Datadog Infrastructure service is very similar to the Site24x7 Infrastructure monitoring system. This is a cloud-based service that covers all Azure services from server space to databases and other applications.
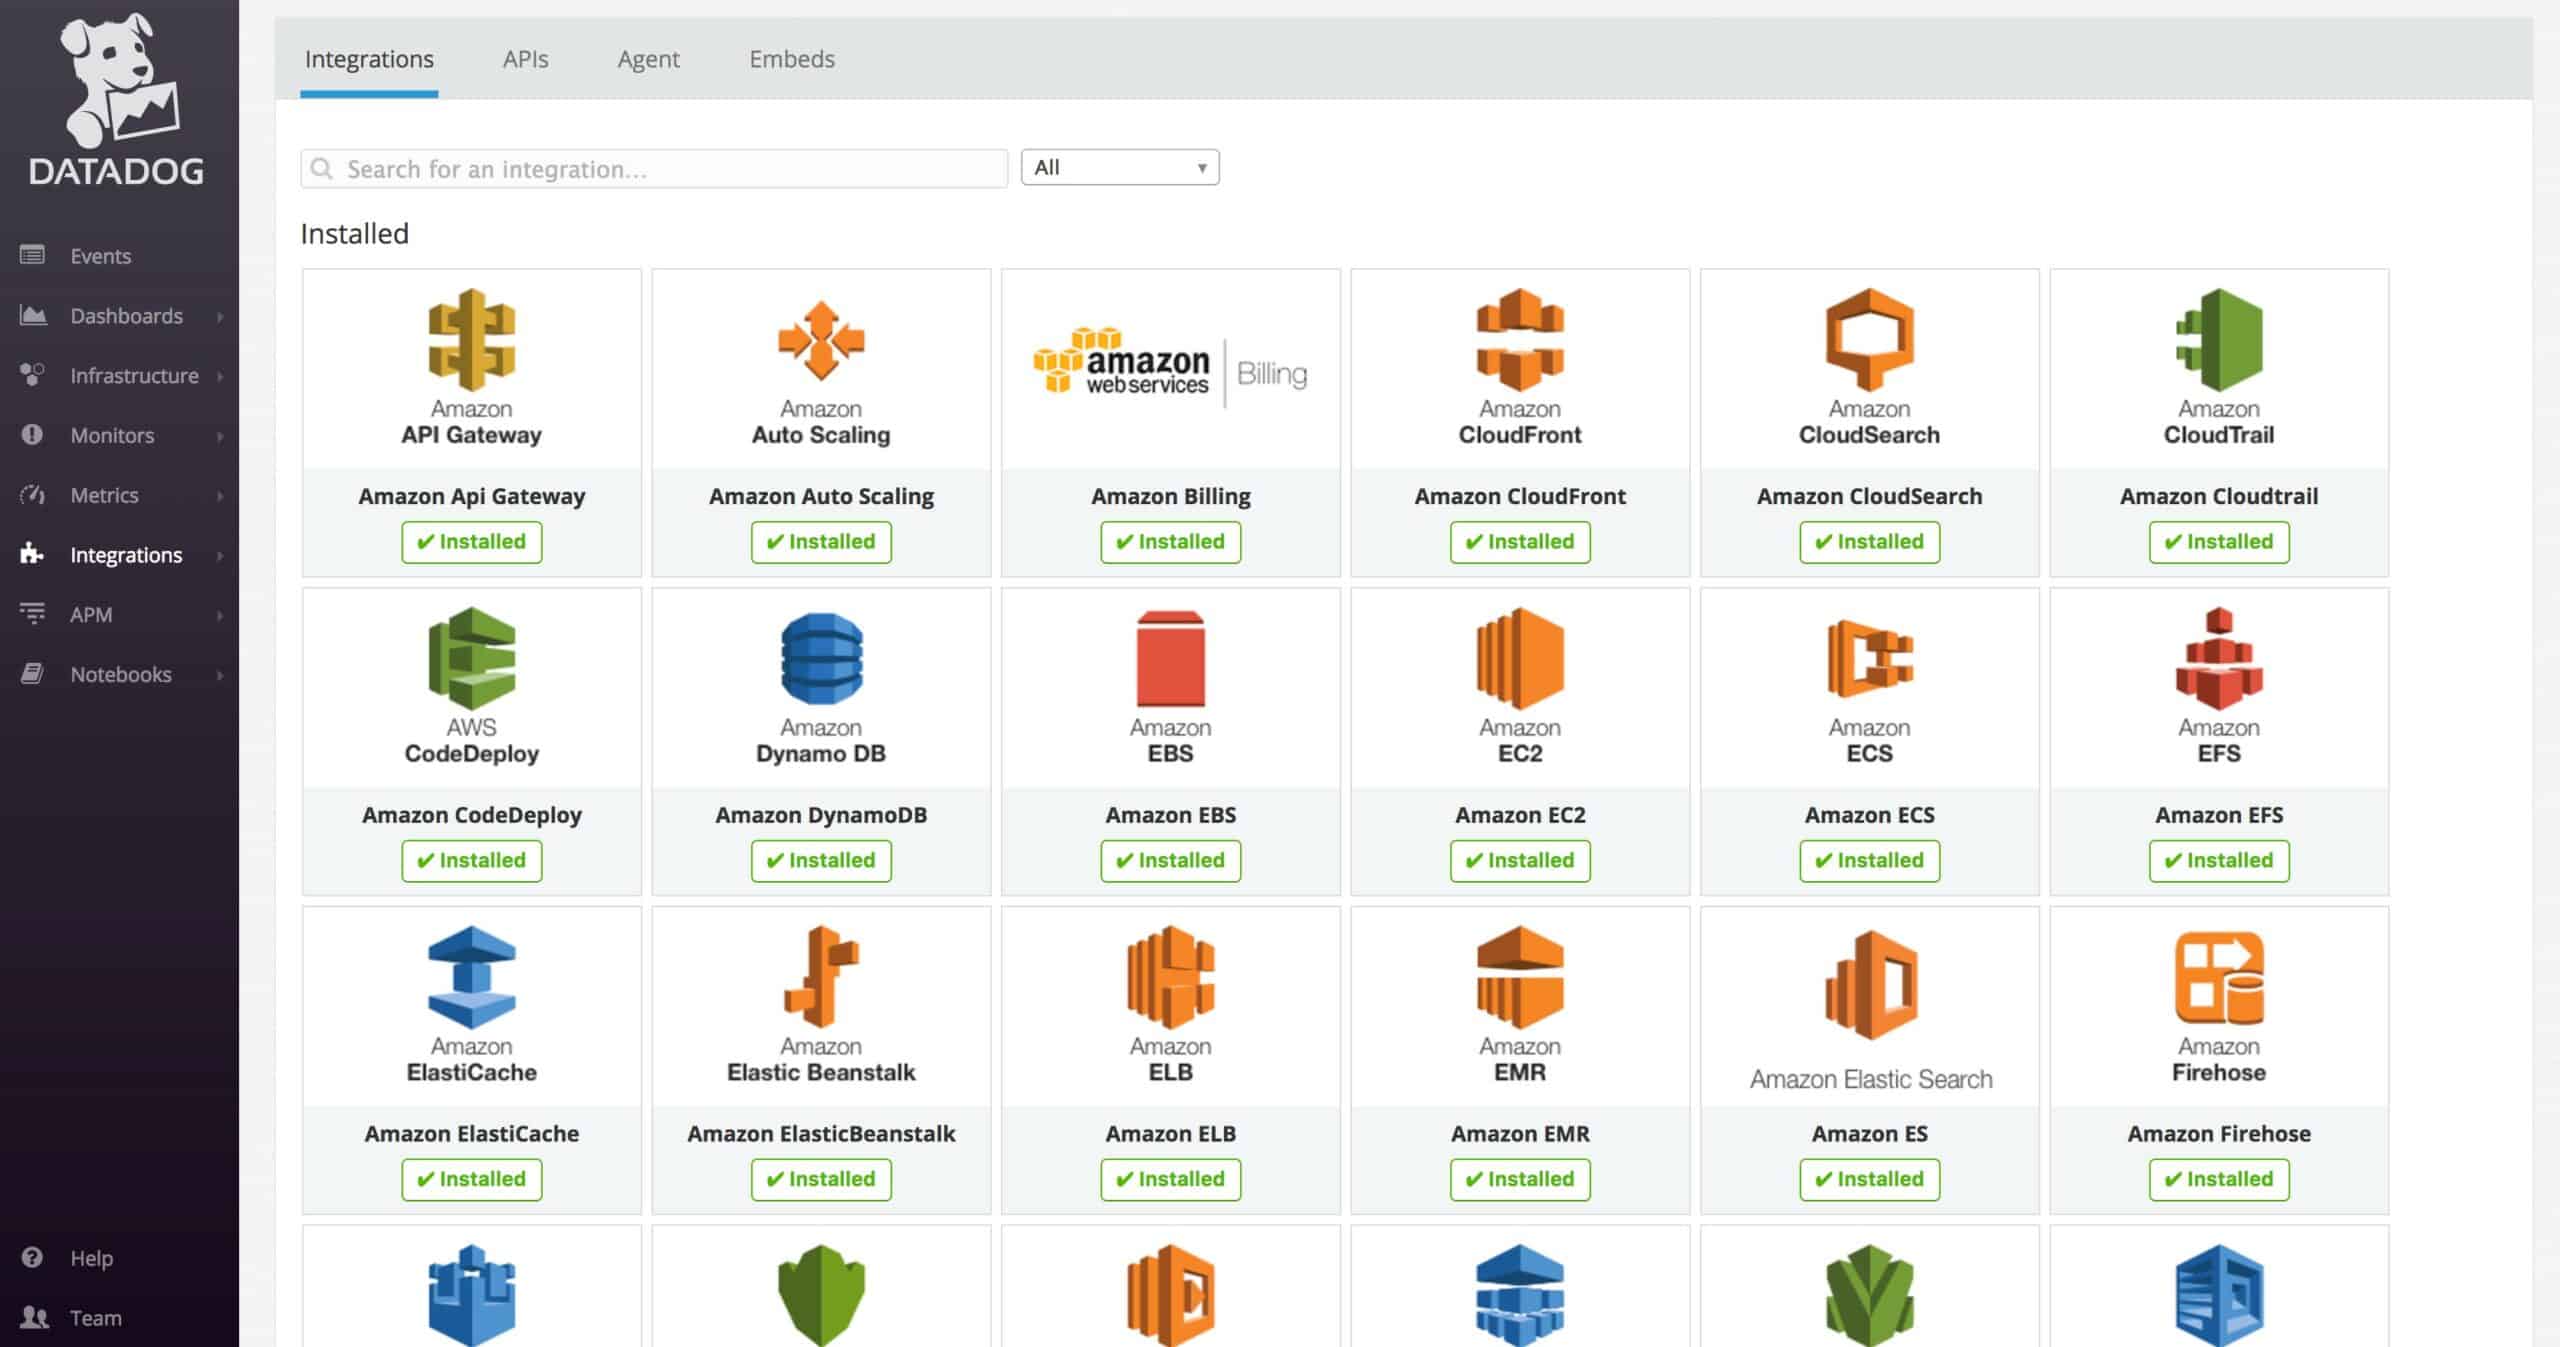
This system is able to combine the monitoring of Azure services with monitors for other cloud platforms and also on-premises applications and the servers that host them. The system covers overviews of all monitored resources that lead to drill-down details screens per service.
Datadog Infrastructure is a subscription service and it is available in three editions: Free, Pro, and Enterprise. The free version will monitor up to five hosts, so depending on how many services you subscribe to, this capability might not be enough. Each Azure service counts as a separate host for Datadog.
The Pro service of Datadog Infrastructure includes all of the straightforward monitoring services that you need. However, the Correlations package, which is an application dependency mapping service and a machine learning threshold setting module, called Watchdog, are only available in the Enterprise plan. You can get a 14-day free trial of either of the two Datadog Infrastructure paid editions.
5. ManageEngine Applications Manager
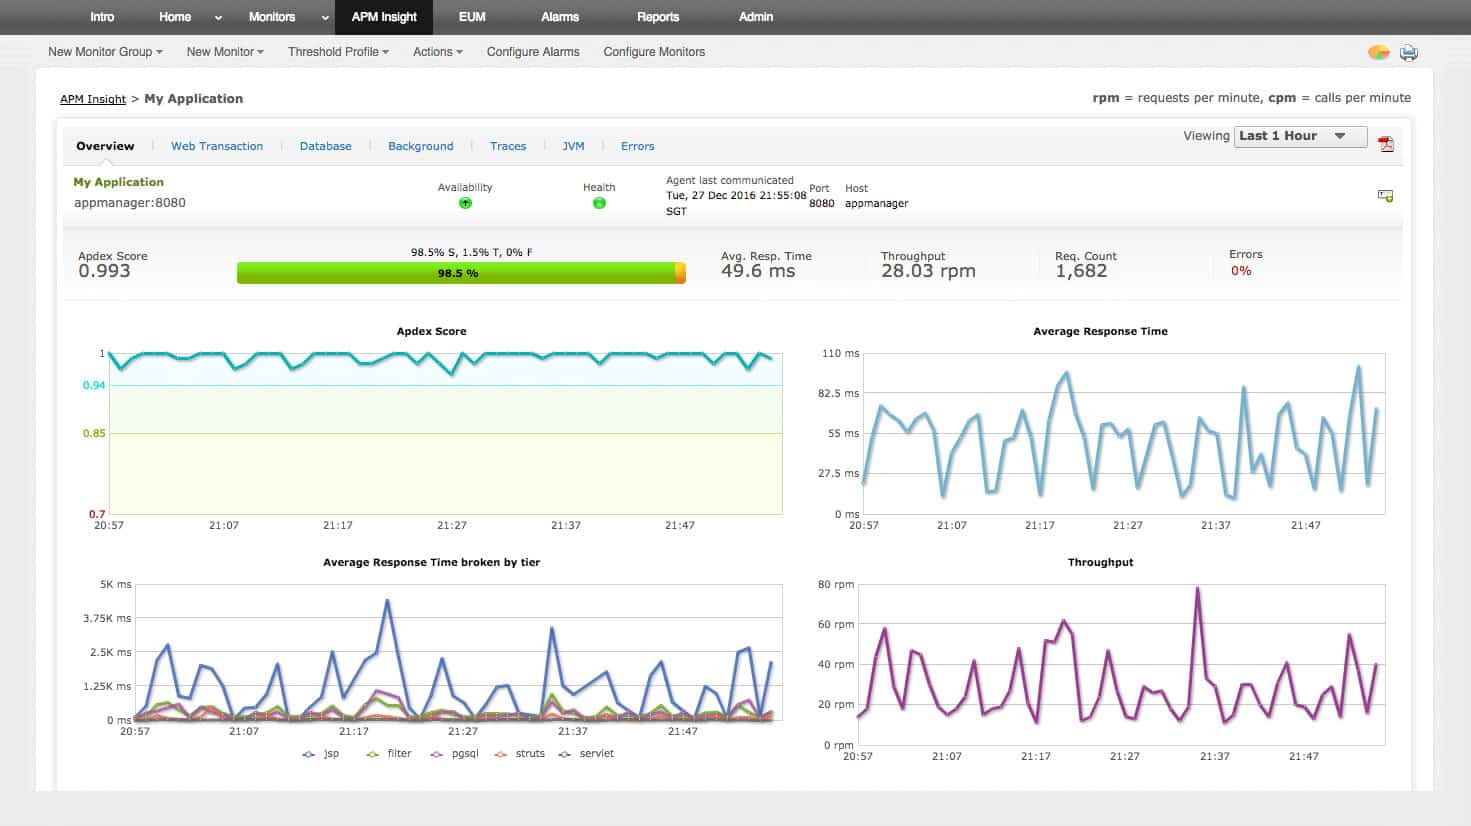
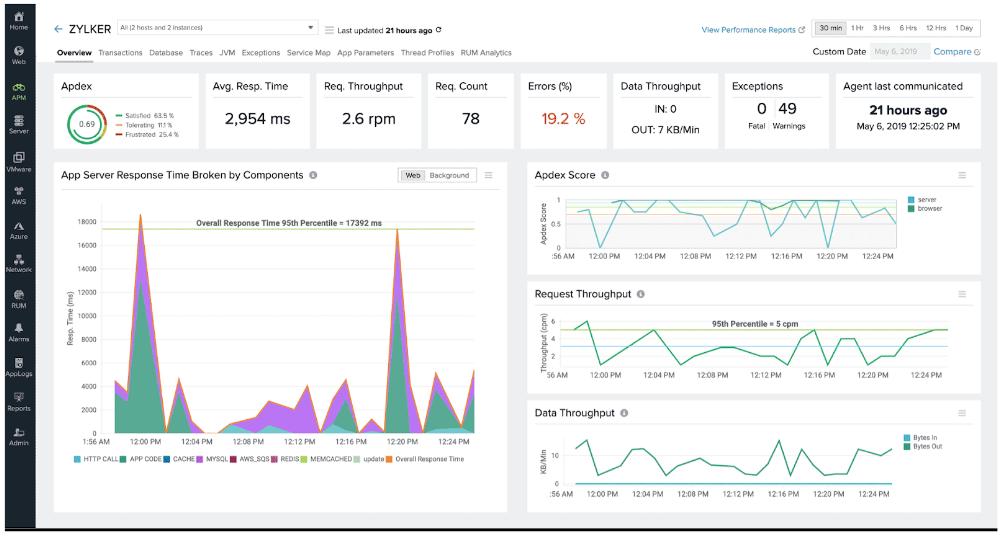
ManageEngine Applications Manager is an on-premises monitoring package that can supervise the performance of on-premises applications and also cloud services, such as Azure.
The system monitors statuses of Azure server accounts, such as CPU, memory, and network traffic and it also watches VM roles. Once it is given a root account, it traces through all connected technologies, mapping the virtual infrastructure and identifying any changes to services. It tracks error rates and traffic rates to get a thorough and continuous assessment of the virtual infrastructure supplied by Azure.
While monitoring Azure, the Applications Manager also tracks your other assets, including services provided by platforms that rival Azure. The monitor stitches together an application dependency map and Azure services form part of that tapestry.
The monitoring service operates a system of performance thresholds that trigger alerts if they are crossed. This system automates monitoring because support staff doesn’t need to worry about performance unless it notified by alerts.
Graphs on the console make it clear where problems are building because of color-coded statuses. The application dependency maps of the Applications Manager make root cause analysis a lot easier and speed up problem resolution.
Applications Manager installs on Windows Server and Linux. There are three versions of Applications Manager: Free, Professional, and Enterprise. The Free edition is limited to five monitors. The Professional edition is for a single site and the Enterprise edition is suitable for large businesses that require a large volume of monitoring activity. You can test Applications Manager on a 30-day free trial.
6. Paessler PRTG
Paessler PRTG is a collection of resource monitors. Each customer gets the full package but customizes the system by deciding which monitors to turn on. The price for the service depends on the number of monitoring credits that you buy.
PRTG monitors Azure in conjunction with another system, called Martello iQ. The monitoring system relies on sensors provided by another partner, called AutomonX. In total, the system provides 18 different monitors for Azure services. The dashboard shows an overview of all of your Azure services, allowing a drill down through to detail pages for each service. All of the screens for Azure monitoring include color-coded graphics that make statuses very easy to identify.
The Azure monitoring service includes performance thresholds and alerts to automate monitoring. As well as monitoring Azures services, PRTG can supervise other resources related to networks, services, and applications. This enables you to monitor all of your infrastructure from one console.
PRTG installs on Windows Server and you can get it on a 30-day free trial.
7. Dynatrace
Dynatrace is an application and cloud services monitoring system that integrates innovative AI processes into its platform. Azure services are included in the monitoring capabilities of this service.
The Dynatrace system starts its service by exploring your Azure accounts. It can also extend its tracking to the services of other cloud platforms and applications hosted on your own servers. This exploration results in an application dependency map.
With the dependency map in place, the Dynatrace system is in a good position to support root cause analysis once performance issues are detected by the constant status monitoring services of the package.
The Dynatrace system is cloud-based and it integrates machine learning in a performance assessment algorithm. That performance expectation fine-tuning makes this system a winner. Some monitoring services preset thresholds for the average business and that means most system administrators have to spend weeks adjusting those levels until they find the right point. The Dynatrace system performs all of those adjustments autonomously.
So, two key AI-driven features give Dynatrace its edge. Those are speedy problem resolution thanks to its application dependency mapping and accurate performance assessment thanks to machine learning applied to alert thresholds. One issue that some might have Dynatrace is that its visibility ends with the server. It doesn’t have any solutions for network problems. However, that is an issue for on-premises monitoring, and for Azure monitoring; the network isn’t a priority.
Dynatrace is a subscription service charged at a rate per month. There is no deposit required and no minimum service period. You can get a 15-day free trial to assess the system for yourself.
8. Opsview
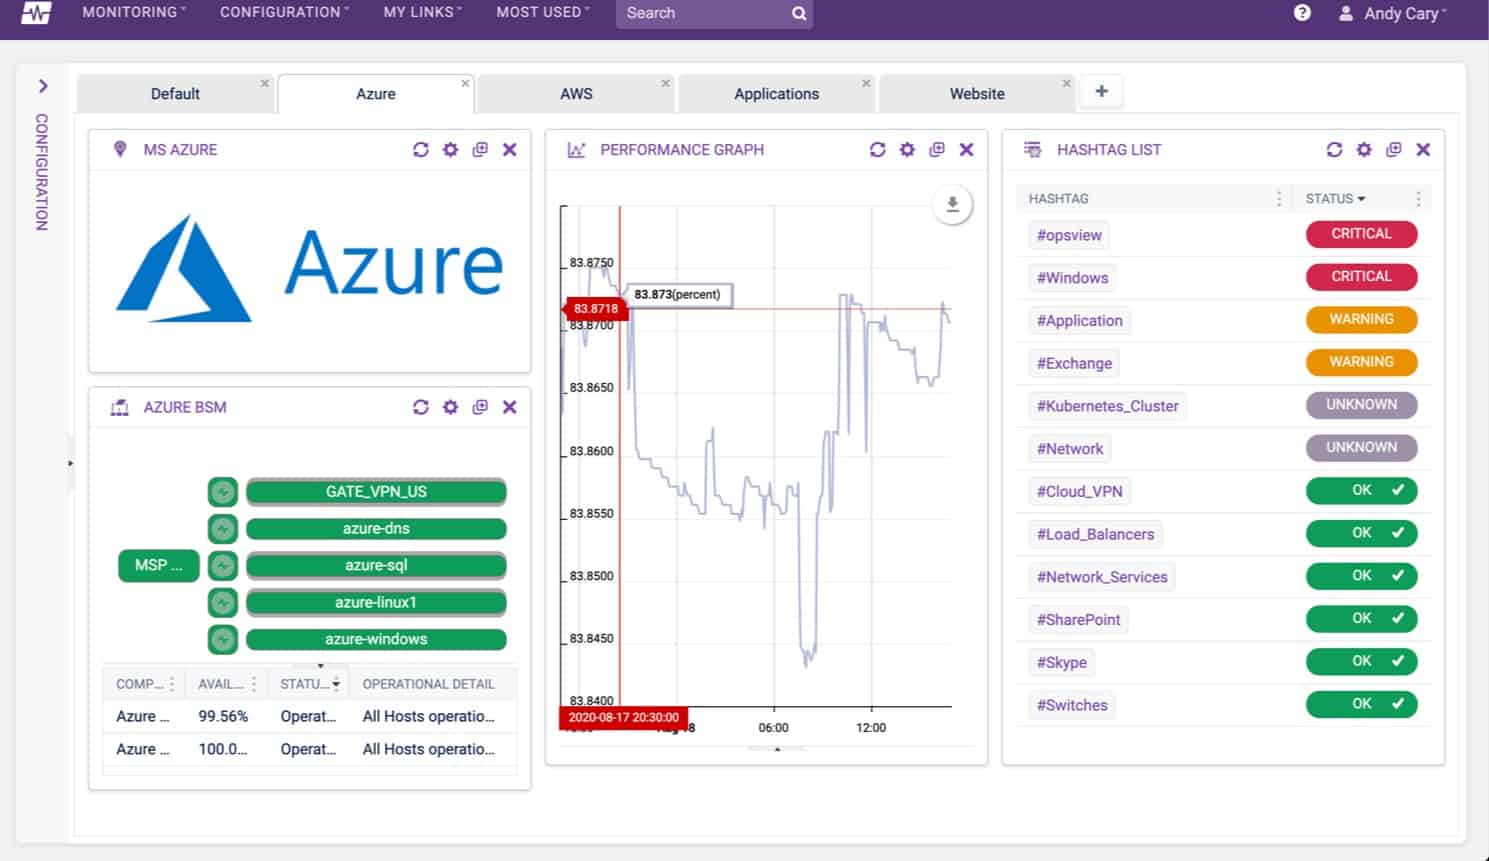
Opsview is able to present a single view of hybrid systems, monitoring resources anywhere, including Azure services. It is able to show performance metrics and availability statistics for all of your Azure subscriptions.
A nice presentational feature of Opsview is that it can be cast onto large screens around the operations center, creating a buzz of efficiency around the operations team. That looks very impressive when you are giving clients a tour.
Opsview has special procedures for monitoring websites and Web services and it can trace application dependencies through to the host services – that includes Azure resources. The Opsview tracing system isn’t restricted to just one platform – it will chain back and identify application dependencies regardless of where each service is resident.
Beneath your services and applications, Opsview has infrastructure monitoring capabilities that can accurately track virtualizations, monitoring each server and its dependent virtual machines. This service is particularly designed to monitor internet-connected services, so it tracks response times point-to-point rather than examining hops on networks.
Opsview is available in three editions. The SMB plan is for small businesses and the Enterprise plan is tailored to large organizations. Both of those packages are for on-premises installation on Linux servers. There is also the Opsview Cloud plan, which is hosted. You can get a demo of the cloud service.
L’article 8 Best Azure Monitoring Tools est apparu en premier sur Comparitech.




0 Commentaires