
You will hear a lot of different definitions of a “data center.” Many, today, apply the term to Managed Service Providers (MSPs) or cloud platforms. There is a sense that the data center is an outsourced service. However, this is only a partial view of the data center model. In-house IT departments also operate as data centers. Any unit that manages storage and processing servers and makes applications and data available to users is a data center.
There is a great movement among multi-site businesses to centralize all IT services in one site. This creates a data center. Also, single-site IT services are data centers.
So, you might not have applied the term “data center” to your operation. Nonetheless, you’ve got one. A key concept to take onboard with your IT operation is to treat them as outsourced even if they are run in-house. This is the Service Desk concept. Make your IT department act as a separate company and treat the managers of other departments as clients. The data center is a cost center and also a profit center.
Here is our list of the six best data center monitoring tools:
- SolarWinds IT Operations Manager EDITOR’S CHOICE An IT system monitoring tool that watches performance all the way up from the network to applications. The tool includes lots of problem tracing features and alerts for developing issues. It installs on Windows Server. Start a 30-day free trial.
- Site24x7 All-in-one A cloud-based monitoring service that can supervise the performance of networks, servers, applications, and websites. Its automated processes lighten the load of data center technicians.
- Datadog Infrastructure A SaaS monitoring system that can supervise the performance of applications and servers and also virtual infrastructure.
- Paessler PRTG An adaptable all-in-one monitoring package that can be tailored by deciding which sensors to activate. It installs on Windows Server.
- ManageEngine OpManager Plus A combination of network, server, and application monitors that includes configuration management and IP address management. It is available for Windows Server and Linux.
- Nagios XI A complete monitoring package for networks, servers, and applications. It runs on Linux or on Windows Server over a hypervisor.
Data center service management
The idea of creating a data center applies mostly to accounting. Other departments need to pay the data center for services and if the in-house data center can satisfy requirements more cost-effectively through outsourcing, then that is the decision of the data center staff and is not of interest to the clients within other company departments.
The data center issues contracts for services to other departments and commits to Service Level Agreements (SLAs). If it then outsources that work, it needs to roll the SLA through on the new contract. Once the data center is fully functional, managers can take their budget directly from income and not need to negotiate with the Accounting Department over every single purchase.
However, in order to avoid going bust (in theory), the data center manager needs to put monitoring systems in place that prevent service deterioration and enable the service to meet its service level agreements.
When shopping for suitable system monitoring software, the data center manager needs to look for systems that will spot evolving problems early. There is no software package that can stop all problems from arising. However, there are systems that can identify them before they become noticeable to users.
You need a system that is going to take care of normal operations and only require input from staff at those rare moments when a performance issue is developing. This allows you to get maximum value out of those highly paid IT technicians on your payroll.
The best data center monitoring tools
When looking at an ideal monitoring package for a data center, we focus on the “monitoring” part of this requirement. Although there are some very excellent Service Desk and Help Desk systems out there, we are just concerned here with the system monitoring tools that you will need. We won’t be identifying the asset management or incident management systems that are available.
You need a system that provides one interface for all system monitoring functions. Most IT monitoring services are segmented into network device monitoring, network traffic monitoring, server monitoring, and application monitoring. If you can get one package that performs all of those functions, you cut down the training time that your staff needs in order to fully support all infrastructure.
You can read more about each of these packages in the following sections.
1. SolarWinds IT Operations Manager (FREE TRIAL)

The IT Operations Manager watches all IT services from the network through to applications. This is on-premises software. However, the packages are able to reach across the Internet and monitor cloud services as well.
This tool is ideal for a busy data center because it identifies connections between applications and services to create an application dependency map. It is also able to identify supporting infrastructure all the way down to network paths. The infrastructure that the IT Operations Manager can monitor also includes virtual systems.
The system sets itself up, exploring the network for equipment, identifying each device, and logging it. The monitor scans servers for all of the services and applications that they run and it is able to connect to cloud services as well. This initial search creates a full map of the entire system stretching from software down to hardware.
The mapping service of the IT Operations Manager is continuous, so if you make any changes to your system, the monitor will spot them and alter its records.
The application dependency map is in place to speed up root cause analysis. The system imposes acceptable performance thresholds on all of the metrics that it measures and raises an alert if service levels deteriorate. Thresholds on resources look for demand approaching full capacity levels.
System alerts are shown in the dashboard and they can also be sent out as notifications by email, SMS, or Slack message. This lets your team get on with other tasks – they will only be needed for system monitoring if a problem arises.
The existence of the application dependency map and the services stack makes tracing the root cause of problems very easy and so your team can head off problems quickly and keep within the requirements of your SLAs.
The IT Operations Manager installs on Windows Server and you can get it on a 30-day free trial.
EDITOR’S CHOICE
The SolarWinds IT Operations Manager is our top pick for a data center monitoring tool because it covers all resources from software to hardware whether on your site or on the cloud. This service includes dependency mapping and stack awareness that shortcuts problem resolution when issues arise. Staff doesn’t need to watch the console for the monitor because they will be notified when an evolving issue is spotted.
Get a 30-day free trial: solarwinds.com/unified-it-operations-manager/registration
Operating system: Windows Server
2. Site24x7 All-in-one
Site24x7 is a system monitoring service that is hosted in the Cloud. Customers choose from tailored packages that specialize in a specific type of IT resource, such as Website, Infrastructure, and Application Performance Monitoring. If you are running a data center, you may well need all of these monitoring systems. Fortunately, the All-in-One plan gives you exactly that.
If your data center also operates a Help Desk to support users and works for several companies, you might consider the MSP edition instead of the All-in-One plan.
With this Site24x7 monitoring system, you can watch over the performance of networks, servers, applications, and websites. It doesn’t matter where those resources are located because the Site24x7 monitoring systems can supervise cloud-based services as well as on-premises systems.
The system sets itself up with an autodiscovery system that documents all devices. It also searches each device for all of its contents to create a software inventory. The Site24x7 system also watches live events and derives an application dependency map.
The Site24x7 system creates performance thresholds that warn of developing problems if they are crossed. This alerting system buys your team enough time to get to the console and look into the cause of these issues. This gives you the luxury of leaving the Site24x7 service to supervise your data center resources for you.
The All-in-One plan is offered in four editions: Pro, Classic, Elite, and Enterprise. These plans are progressively more expensive and offer successively better services. For example, the bottom two plans poll the system for statuses every minute, while the top two plans check every 30 seconds.
You can get a free trial of any of the Site24x7 All-in-one editions. For example, try the Enterprise edition for free for 30 days.
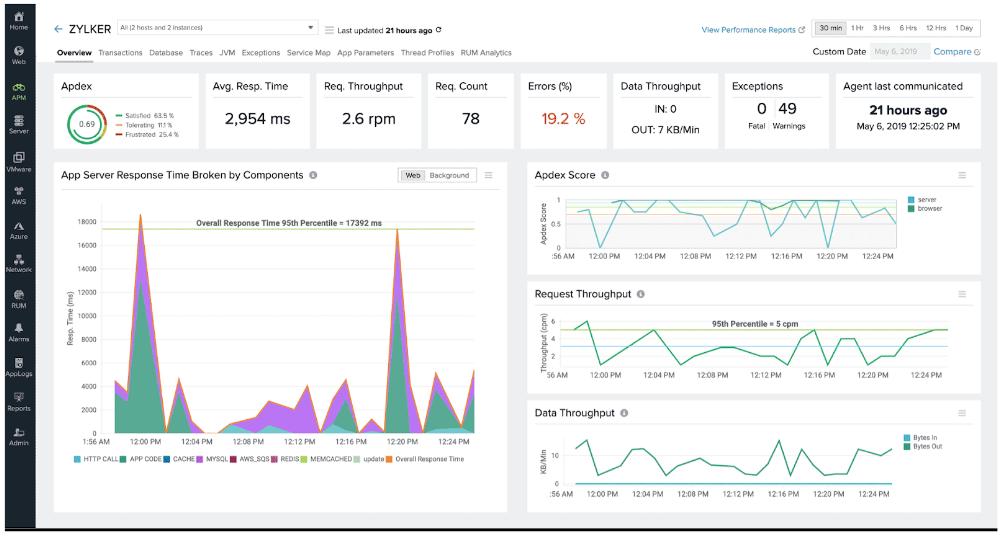
3. Datadog Infrastructure
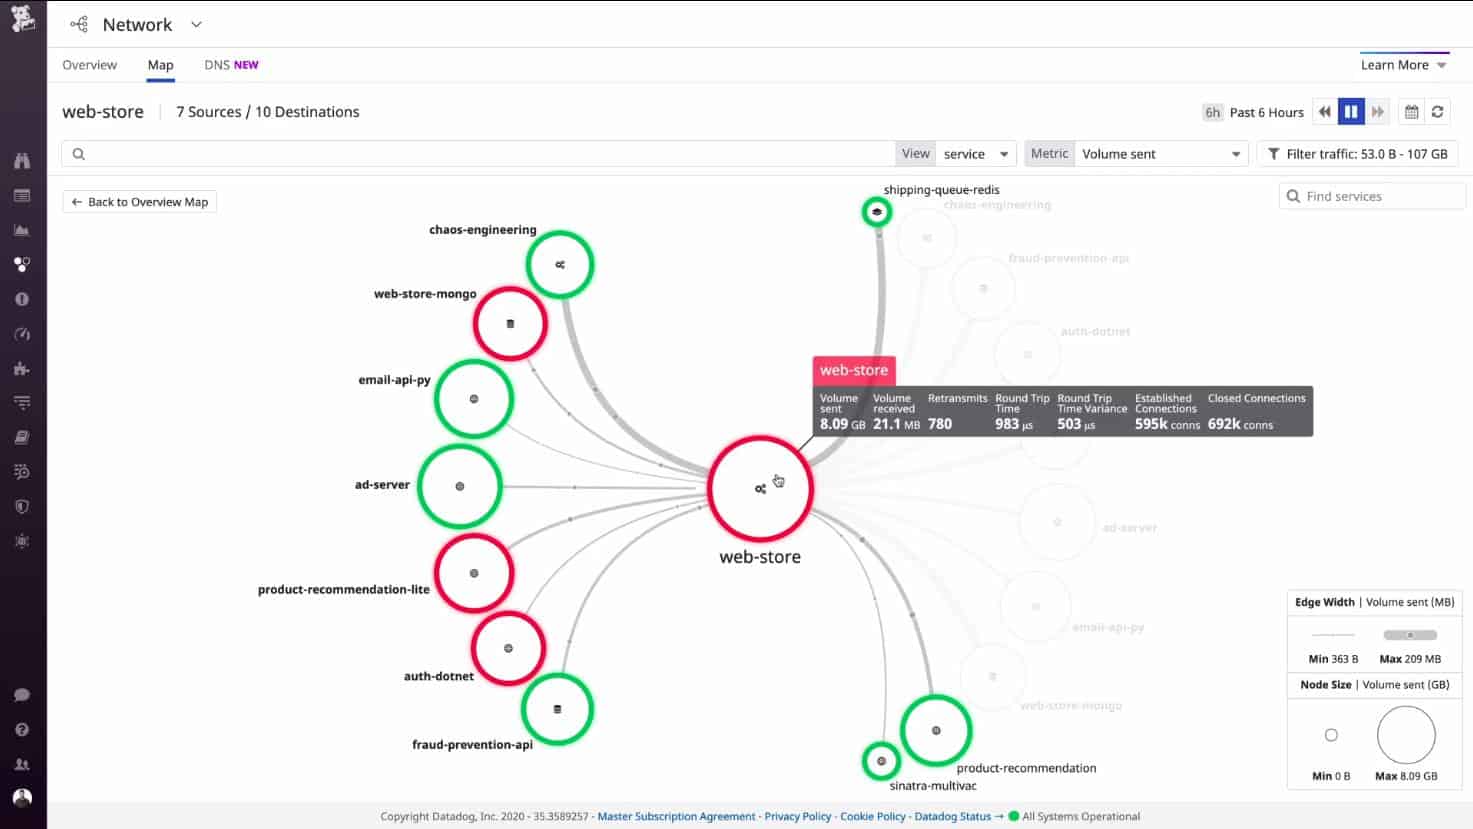
Datadog Infrastructure is a monitoring system for applications, services, and servers. It doesn’t go all the way to the network but it does monitor the network interfaces on the servers that it watches.
Among the systems that this service can monitor are Web servers, file systems, mail servers, and databases. The subscriber gets access to a base system and then customizes it by selecting “integrations.” Integration is an add-on that expands the capability of the monitoring tool.
The advantage of the integration system is that you don’t have to wade through menus of monitors for technology that you don’t have. Each integration creates the capability to monitor a product, such as SQL Server or Exchange Server.
The Datadog Infrastructure system creates an application dependency map that chains through from user-facing software all the way through connection applications and services to the supporting resources of the host. The Datadog service sets performance thresholds that trigger alerts if crossed. These alerts get forwarded to technicians by email or SMS. When technicians arrive at the console, Datadog has already prepared a root cause analysis path with its application dependency map.
There are the editions of Datadog Infrastructure. The first of these is Free but that is limited to monitoring five hosts. The two paid plans are Pro and Enterprise. The Pro plan has all of the utilities that you need. However, the Enterprise edition has all of the automation features that will save you time and take a load off the shoulders of your team. You can get a 15-day free trial of either of the paid plans.
4. Paessler PRTG
Paessler PRTG is an all-in-one monitoring package that is ideal for data centers because it has the ability to monitor networks, servers, and applications. Its capabilities extend to website performance, virtual infrastructure, and remote site resources. It is able to monitor cloud resources as well as on-site infrastructure.
The great thing about PRTG is that it is completely customizable. The package is composed of a large number of individual monitors, called “sensors.” The price for PRTG is set in bands of sensor quantities. So, you buy an allowance and then decide for yourself which sensors you need to turn on. A sensor is linked to a widget or an entire screen in the dashboard. So, you only get the monitoring systems and dashboard screens that you need.
That adaptability of PRTG is one of its advantages. Each screen that you get can be customized. So, you can collect all of the graphs and data lists that are really meaningful to your data center staff.
PRTG runs performance thresholds and alerts, which can be forwarded by email or SMS as notifications. The stack dependency feature in PRTG is adaptable according to how many monitors you have activated. For example, if you use sensors for networks, servers, and applications, the stack will show you the relationship between all of the services in these layers.
PRTG installs on Windows Server and you can get it on a 30-day free trial.
5. ManageEngine OpManager Plus
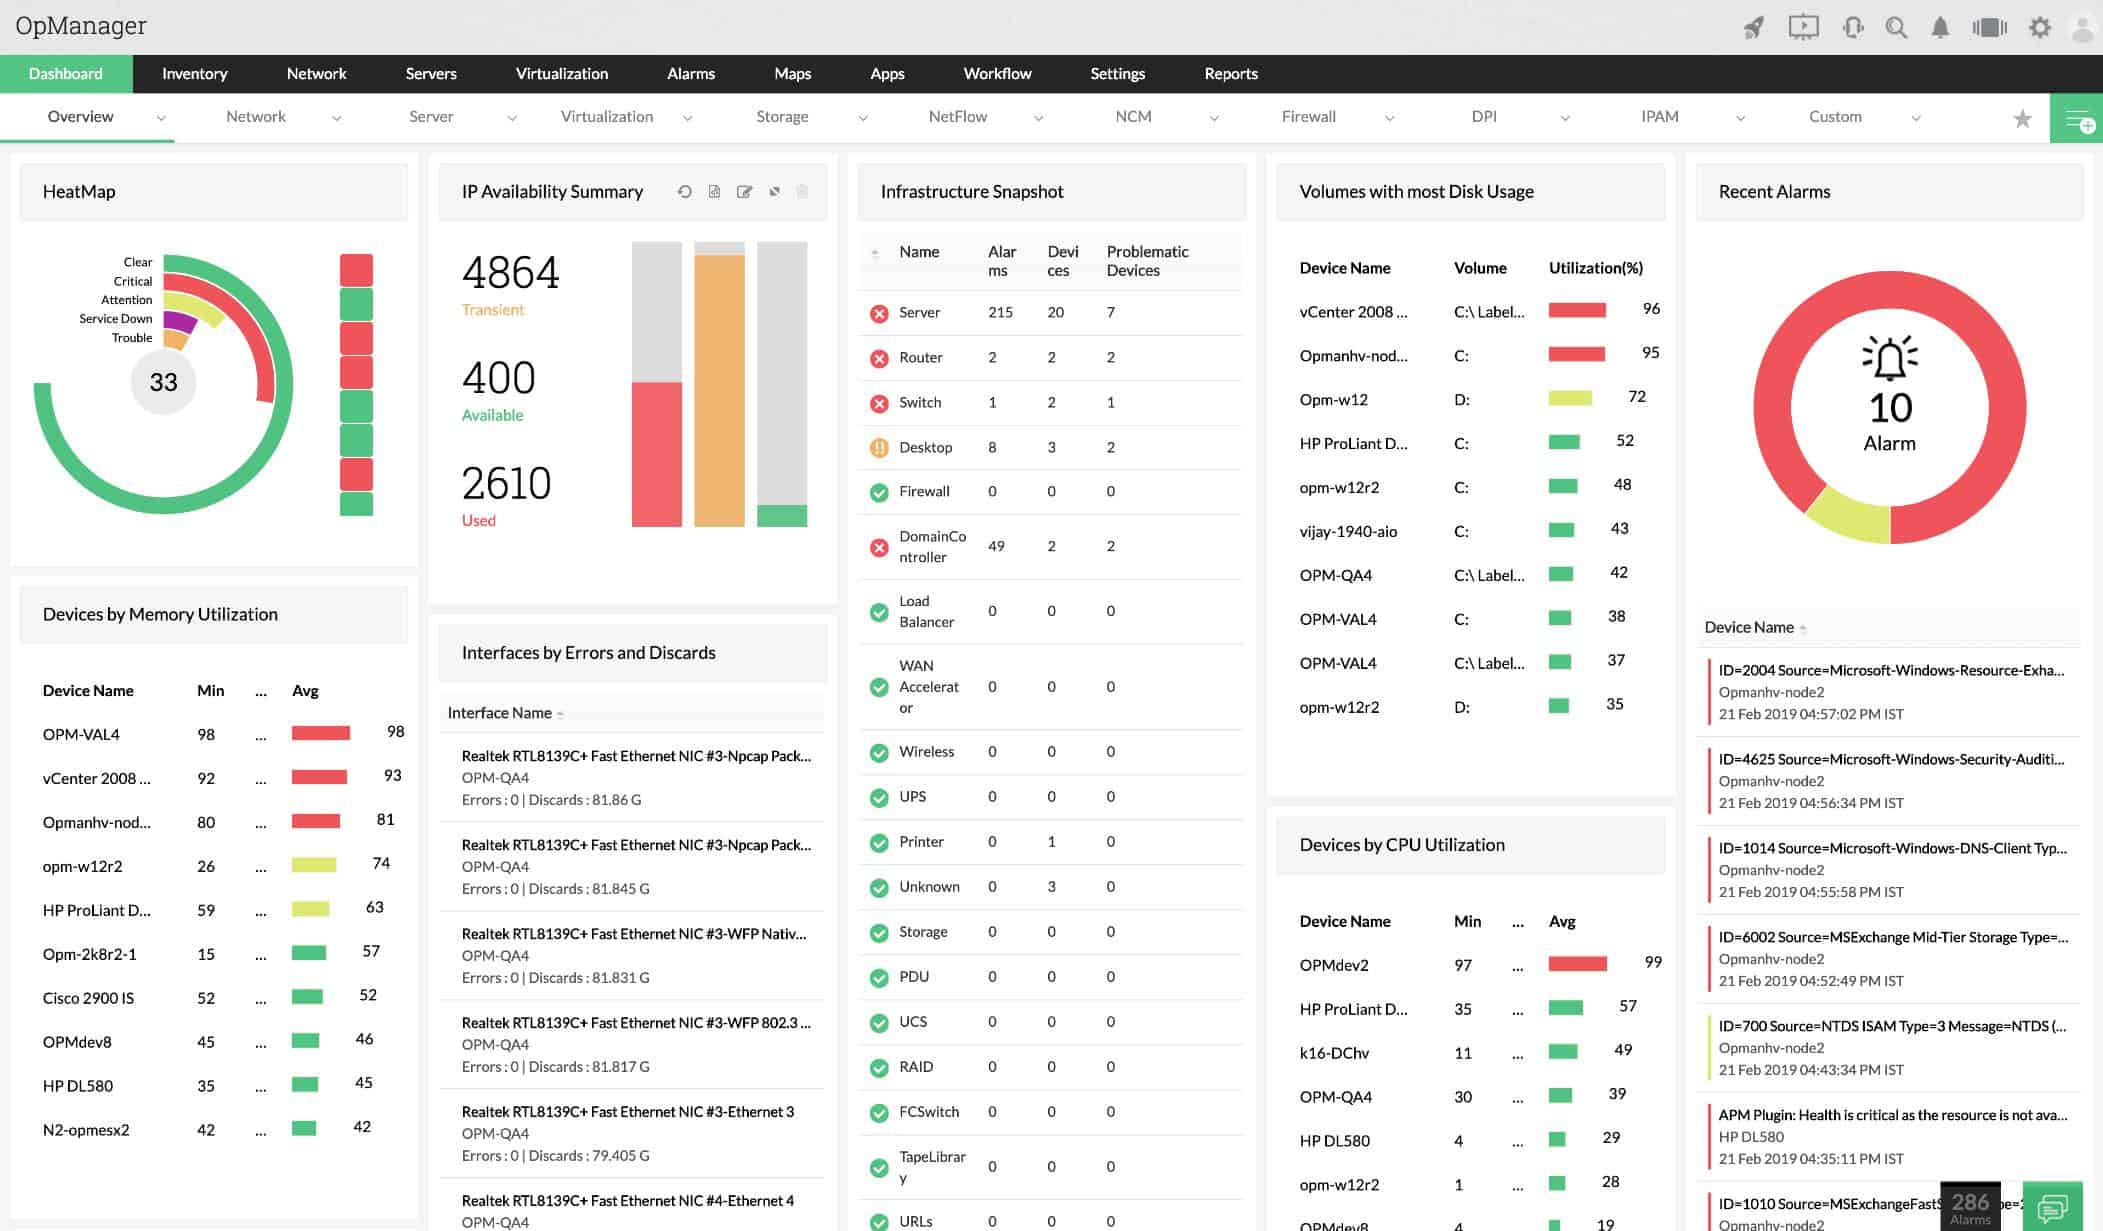
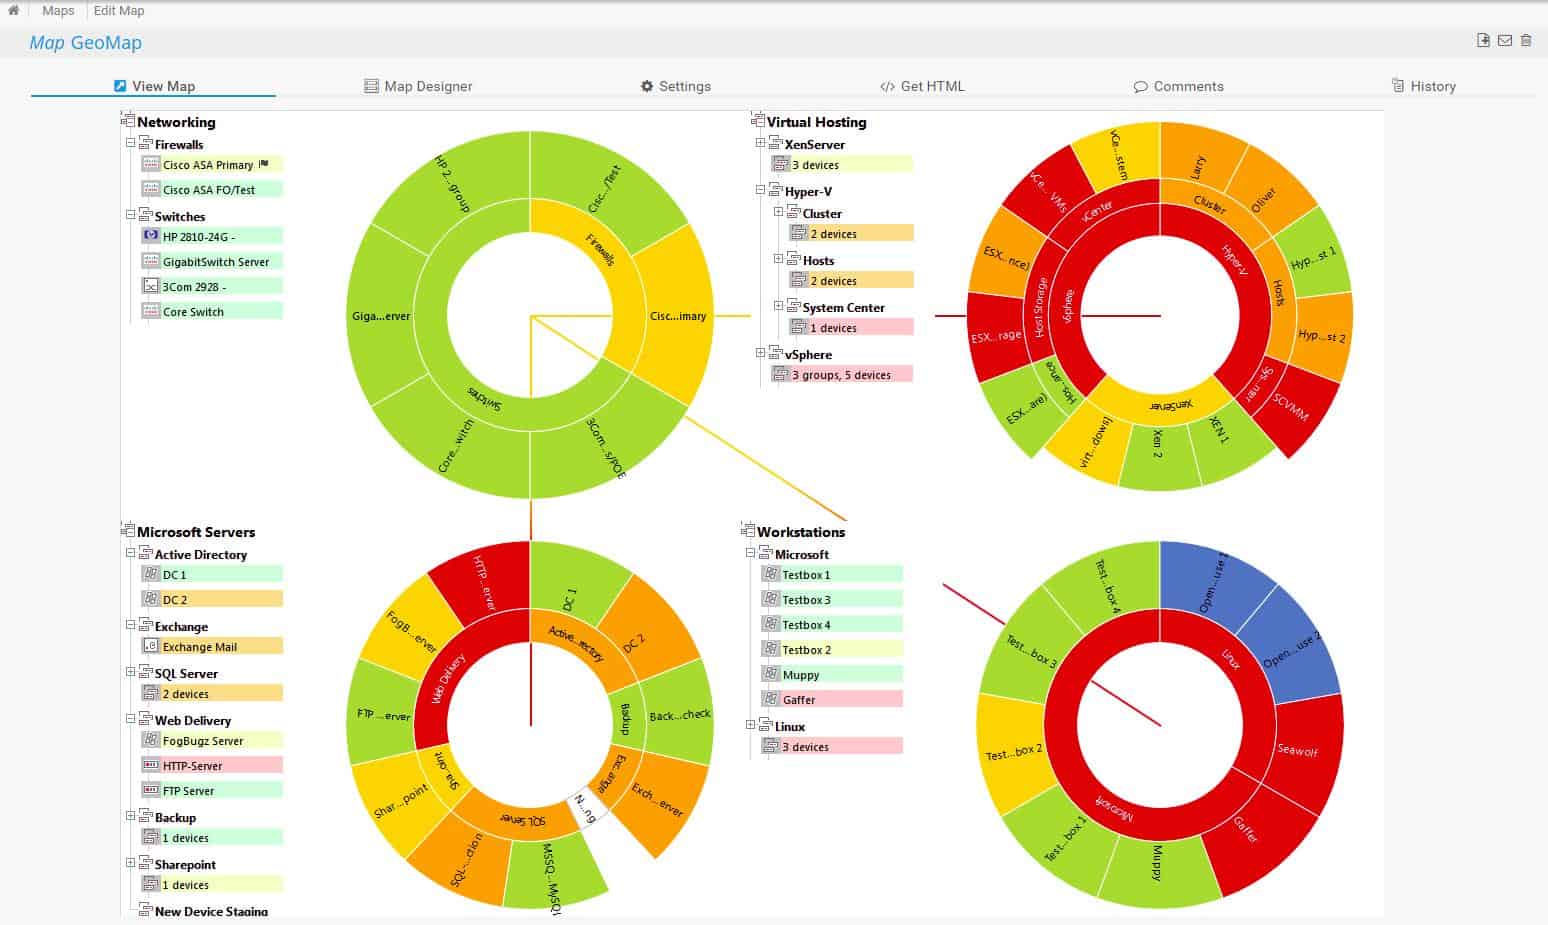
ManageEngine produces a range of standalone monitoring tools, each covering a different type of resource. Fortunately, these tools are all built on the same platform. Even better, ManageEngine offers a bundle of all of its key monitoring tools – this is OpManager Plus. If you run a data center, this package gives you all of the monitoring tools that you need. In addition to those monitors, the package includes a configuration manager and an IP address manager.
With the ManageEngine OpManager Plus system, you can monitor network devices, network traffic, servers, storage servers, firewalls, log servers, switch ports, applications, logical ports, and virtualizations. It can also monitor cloud services and remote sites. So, that is all of the monitoring capability you need.
The entire system sets itself up with an autodiscovery process. That procedure identifies every device connected to the network and then scans each device to compile a software inventory. The network scan creates a network topology map and the software detection system provides a foundation for license management. The system also tracks live activity so it can detect the interdependency between applications, services, and hardware.
Like the other monitoring systems in this list, OpManager Plus uses a system of performance thresholds that, if crossed, trigger alerts. Those alerts can be forwarded as notifications by email and SMS. The tool places these thresholds on every performance metric of every resource that it monitors. It also assembles a dependency stack to aid root cause analysis and it can demonstrate how all of the devices on your network link together.
OpManager Plus can be installed on Windows Server or Linux. You can get a 30-day free trial to examine the system for yourself.
6. Nagios XI
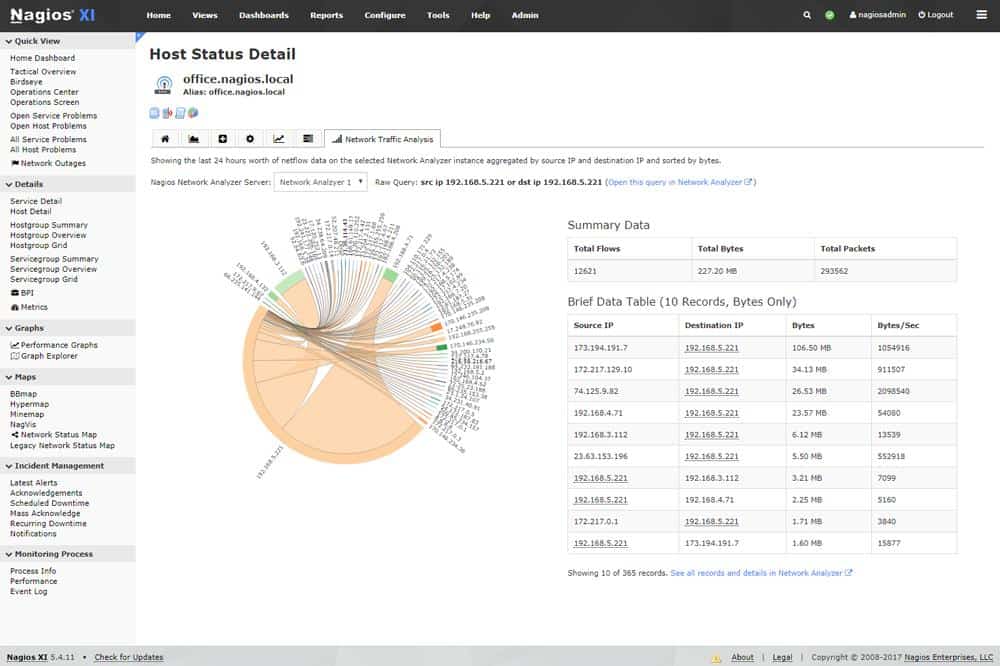
The Nagios XI system is great for data centers because it monitors networks, servers, applications, and services. So, it provides all of the monitoring capabilities you need in one console.
The service includes an autodiscovery service, which identifies all devices connected to the network and compiles an asset inventory. The service also creates a network topology map, which makes network service detection a lot easier. Both the device inventory and network topology map are updated constantly, so they won’t get out of date.
The Nagios XI system is available in two editions: Standard and Enterprise. The Standard edition provides all of the system monitoring tools and you get those services with the Enterprise edition as well. However, the Enterprise edition gives you log auditing tools and SLA goal reports as well as other higher data center management tools.
Nagios XI installs on RHEL, CentOS, Ubuntu, and Debian Linux. If you want to run it on Windows Server, you can achieve that by floating it over a Hyper-V or VMWare hypervisor. You can access Nagios XI on a 30-day free trial. However, if you want it free forever, you should check out Nagios Core, which is the community edition.
L’article 6 Best Data Center Monitoring Tools est apparu en premier sur Comparitech.


0 Commentaires